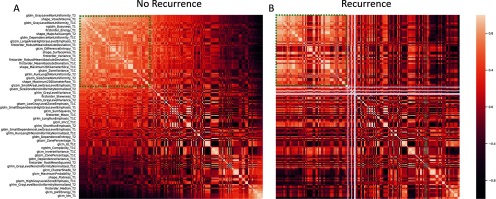
Figure 5.
Comparison of radiomic features from groups which did and did not experience primary tumor recurrence. Correlation maps of the 200 most significant of radiomics features for tumor non-recurrence (A) and recurrence (B). These data were calculated from the peritumoral area in pre-RT images. The 2 correlation maps show clear differences between features based on tumors which will and will not recur.

