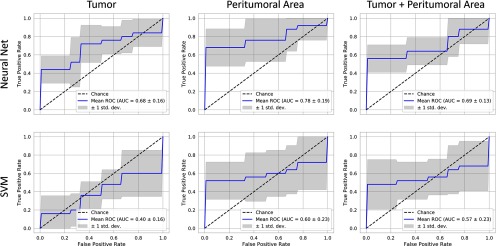
Figure 7.
Recurrence classification from features calculated from pre-RT images receiver operating curve (ROC) curves for prediction accuracy using neural networks and support vector machines (SVMs) for 3 regions examined. The best predictive power is found from features in the peritumoral area (neural network [NN] AUC: 0.78), followed by the tumor and tumor combined with the peritumoral area (NN AUC: 0.68 vs 0.96). The NN outperforms the SVM for all regions.

