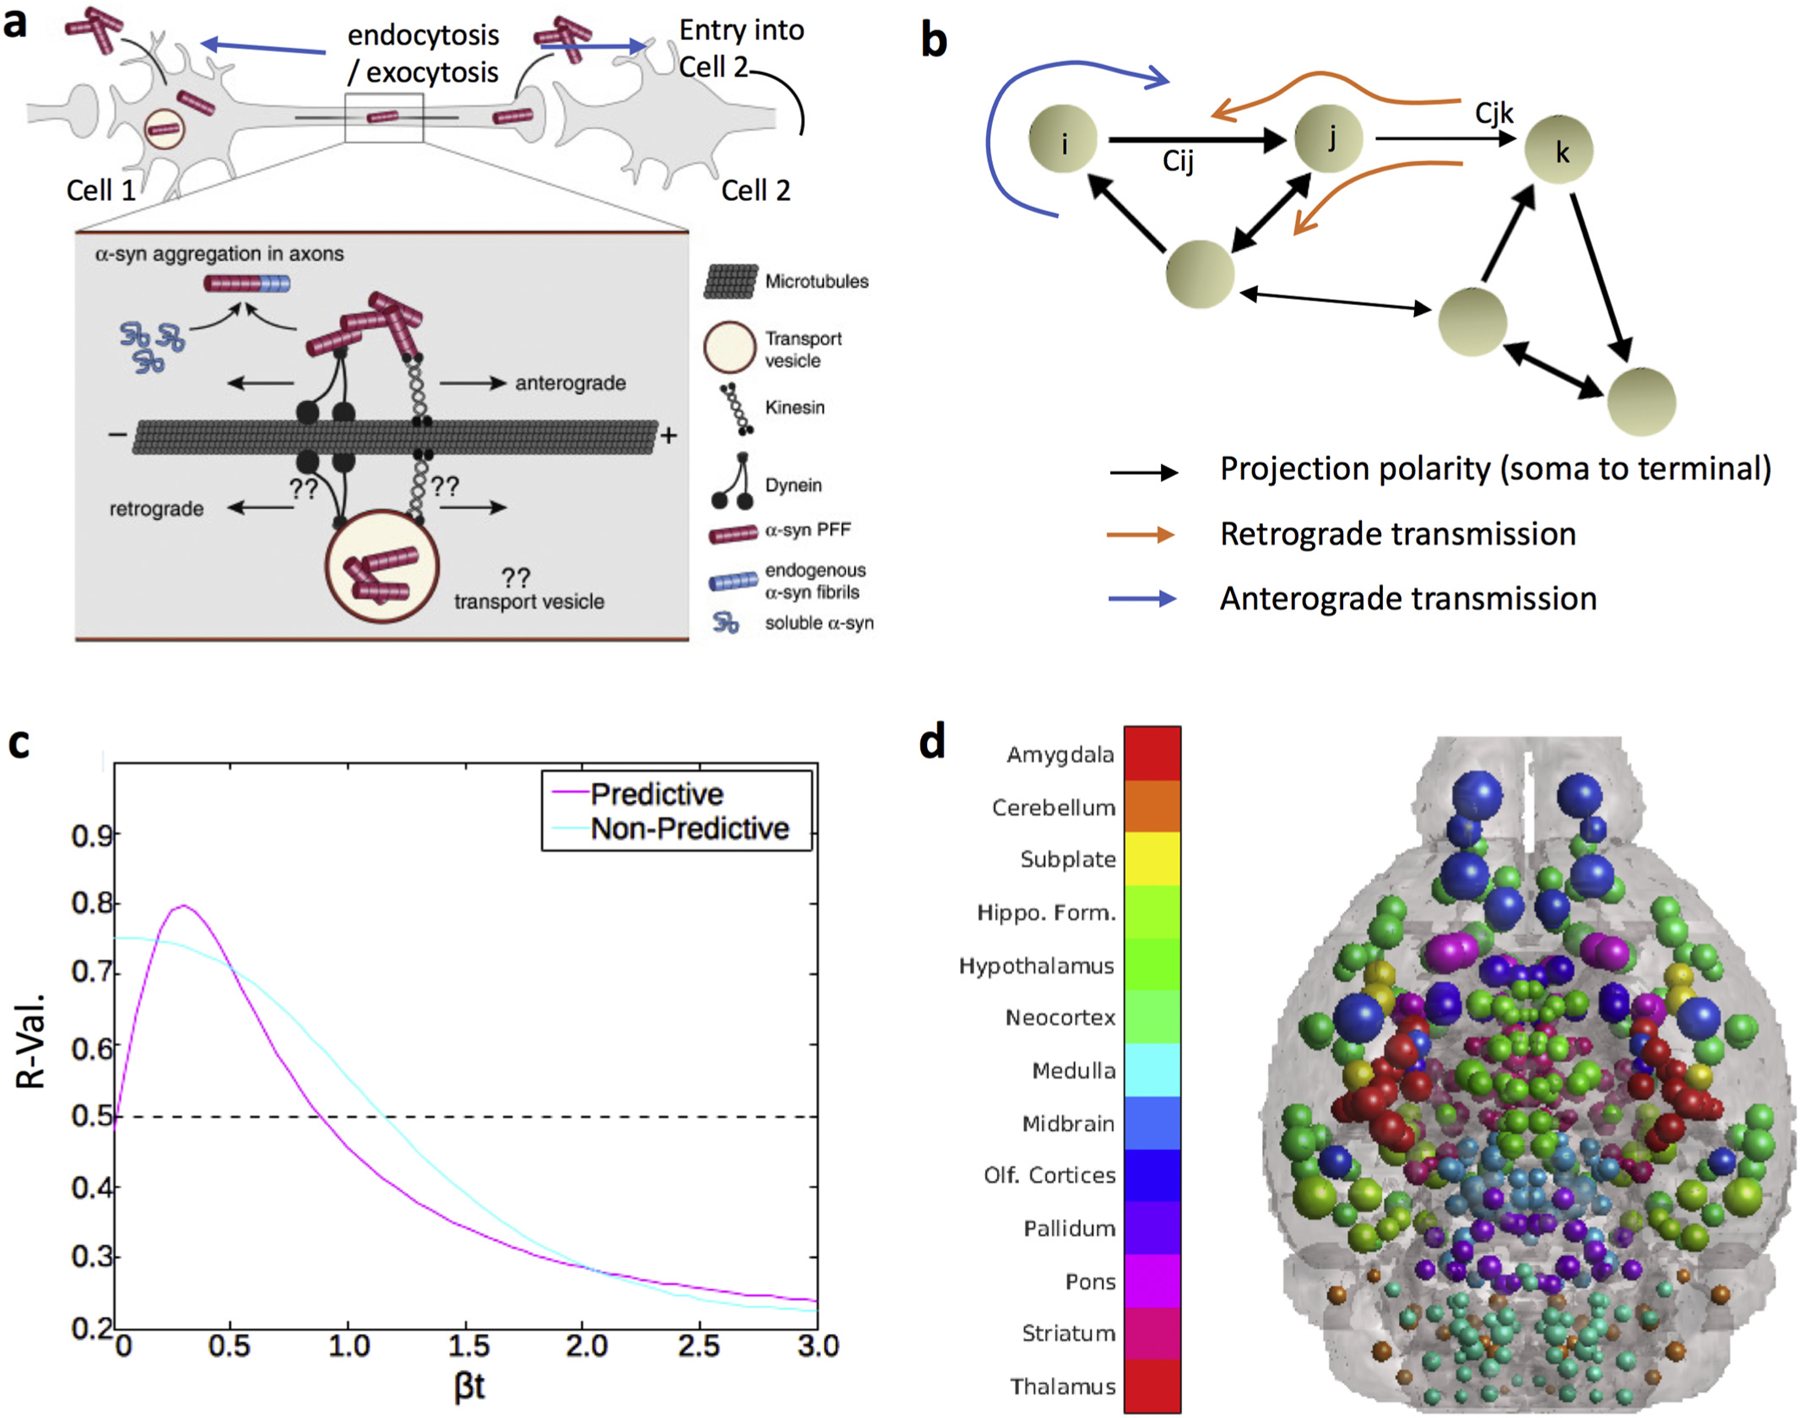
Fig. 1.

Anatomical example of network transmission, what the DNT model represents, and how to assess it. (a) α-Syn fibrils can be internalized both in the dendrite/cell body compartment and in axons. α-Syn fibrils are actively transported along microtubules both in the anterograde (driven by kinesin) and retrograde (driven by dynein) direction, perhaps directly in the cytoplasm or perhaps in transport vesicles following endocytosis. Aggregation is thought to initially occur in axons, where α-syn fibrils can encounter and template the misfolding of soluble endogenous α-syn proteins that are transported along axons for delivery to synapses. Figure adapted with permission from Bieri, et al., 2018. (b) Graphic illustration of the whole brain directional connectivity network, with nodes representing brain regions, and connection strengths {Cij} representing tracer-derived mesoscale connectivity. Examples of anterograde and retrograde transmission on this network are depicted. This macroscopic network transmission model is driven by the cellular-level transmission and transport processes depicted in panel A. (c) Example of a βt-curve showing r-value across βt parameter values for predictive (peak at βt ≥ 0) and non-predictive models (peak at βt = 0). (d) A color legend and brain showing the color scheme, by major region, for all the balls depicting regions in all anatomical illustrations of mouse brains throughout the rest of the paper. The dot sizes correspond to randomly generated “example“or “pseudo“inclusions amounts, per-region, where each dot represents one region in its center of mass. In anatomic illustrations of this nature with actual results, the inclusions amounts will not be random, but will rather be determined by inclusions severity recorded from data or predicted by a given NT model.
