Fig. 3.

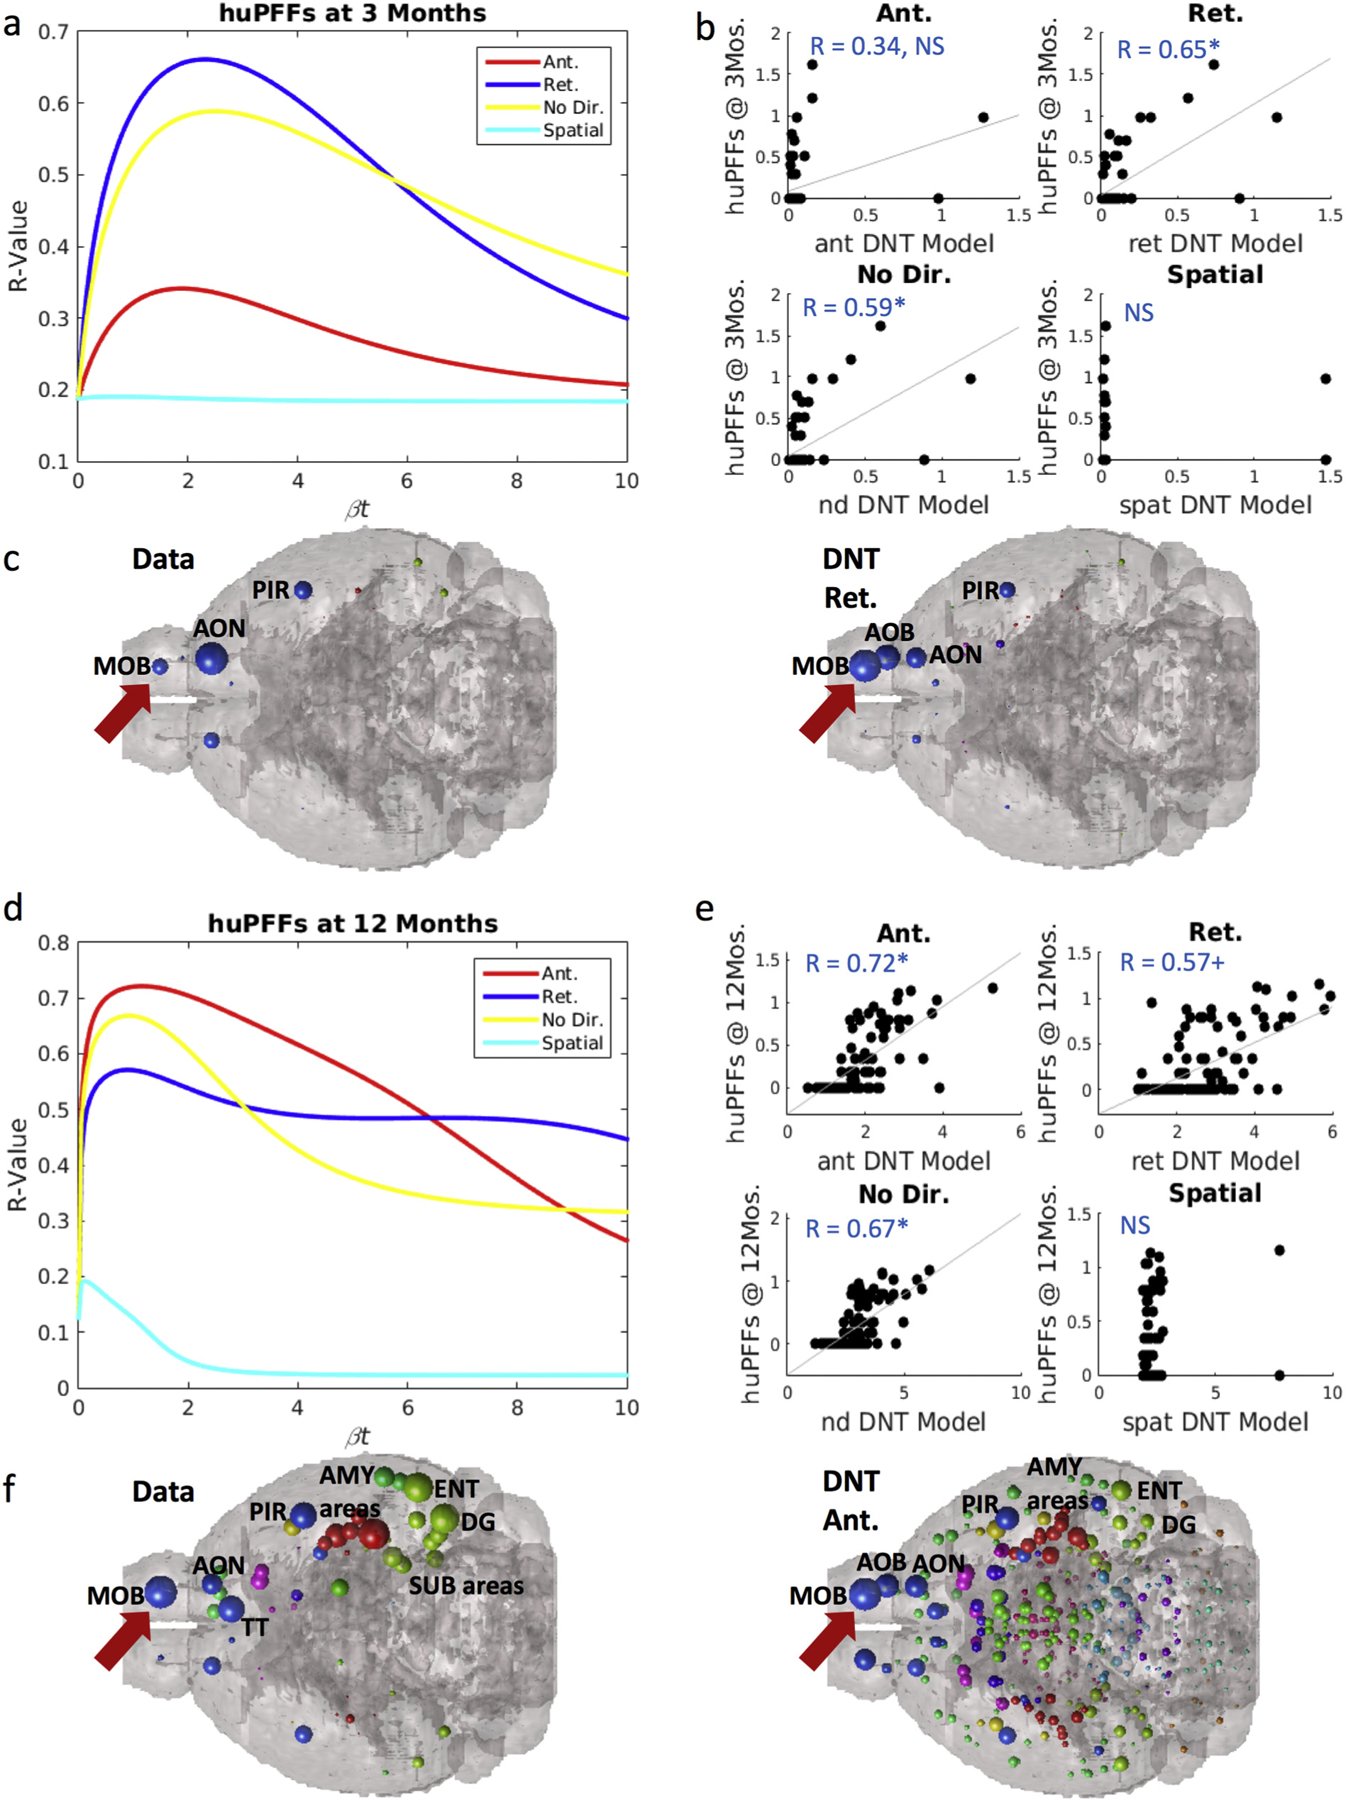
Synuclein inclusion spread is better modeled by retrograde DNT at early timepoints, and anterograde DNT at later timepoints. (a) βt-curve showing NT models’ r-value with huPFF data at 3-months post-injection at different diffusion time constants. (b) Scatterplot of the NT models at their peak β-diffusion time constant, as in (a) to the left, versus data. (c) Anatomical illustrations of huPFF synuclein inclusion data and DNT-retrograde simulation. (d) βt-curve showing NT models’ r-value with huPFF data at 12-months post-injection at different diffusion time constants. (e) Scatterplot of the NT models at their peak β-diffusion time constant, as in (d) to the left, versus data. (f) Anatomical illustrations of huPFF induced synuclein inclusions at 12 months post injection and the corresponding anterograde-DNT simulation. All data and NT simulation values are log-transformed prior to both statistics and anatomical visualizations. AMY = amygdala, AOB = accessory olfactory bulb, AON = anterior olfactory nucleus, DG = dentate gyrus, ENT = entorhinal cortex, MOB = main olfactory bulb, PIR = piriform cortex, SUB = subiculum, TT = tenia tecta. Please see Fig. 1 for color legend for the major region color scheme of the balls denoting regional αsyn inclusions. The red arrow points toward the MOB where the PFFs were injected. + p < .01, * p < .02. (For interpretation of the references to color in this figure legend, the reader is referred to the web version of this article.)
