Fig. 4.

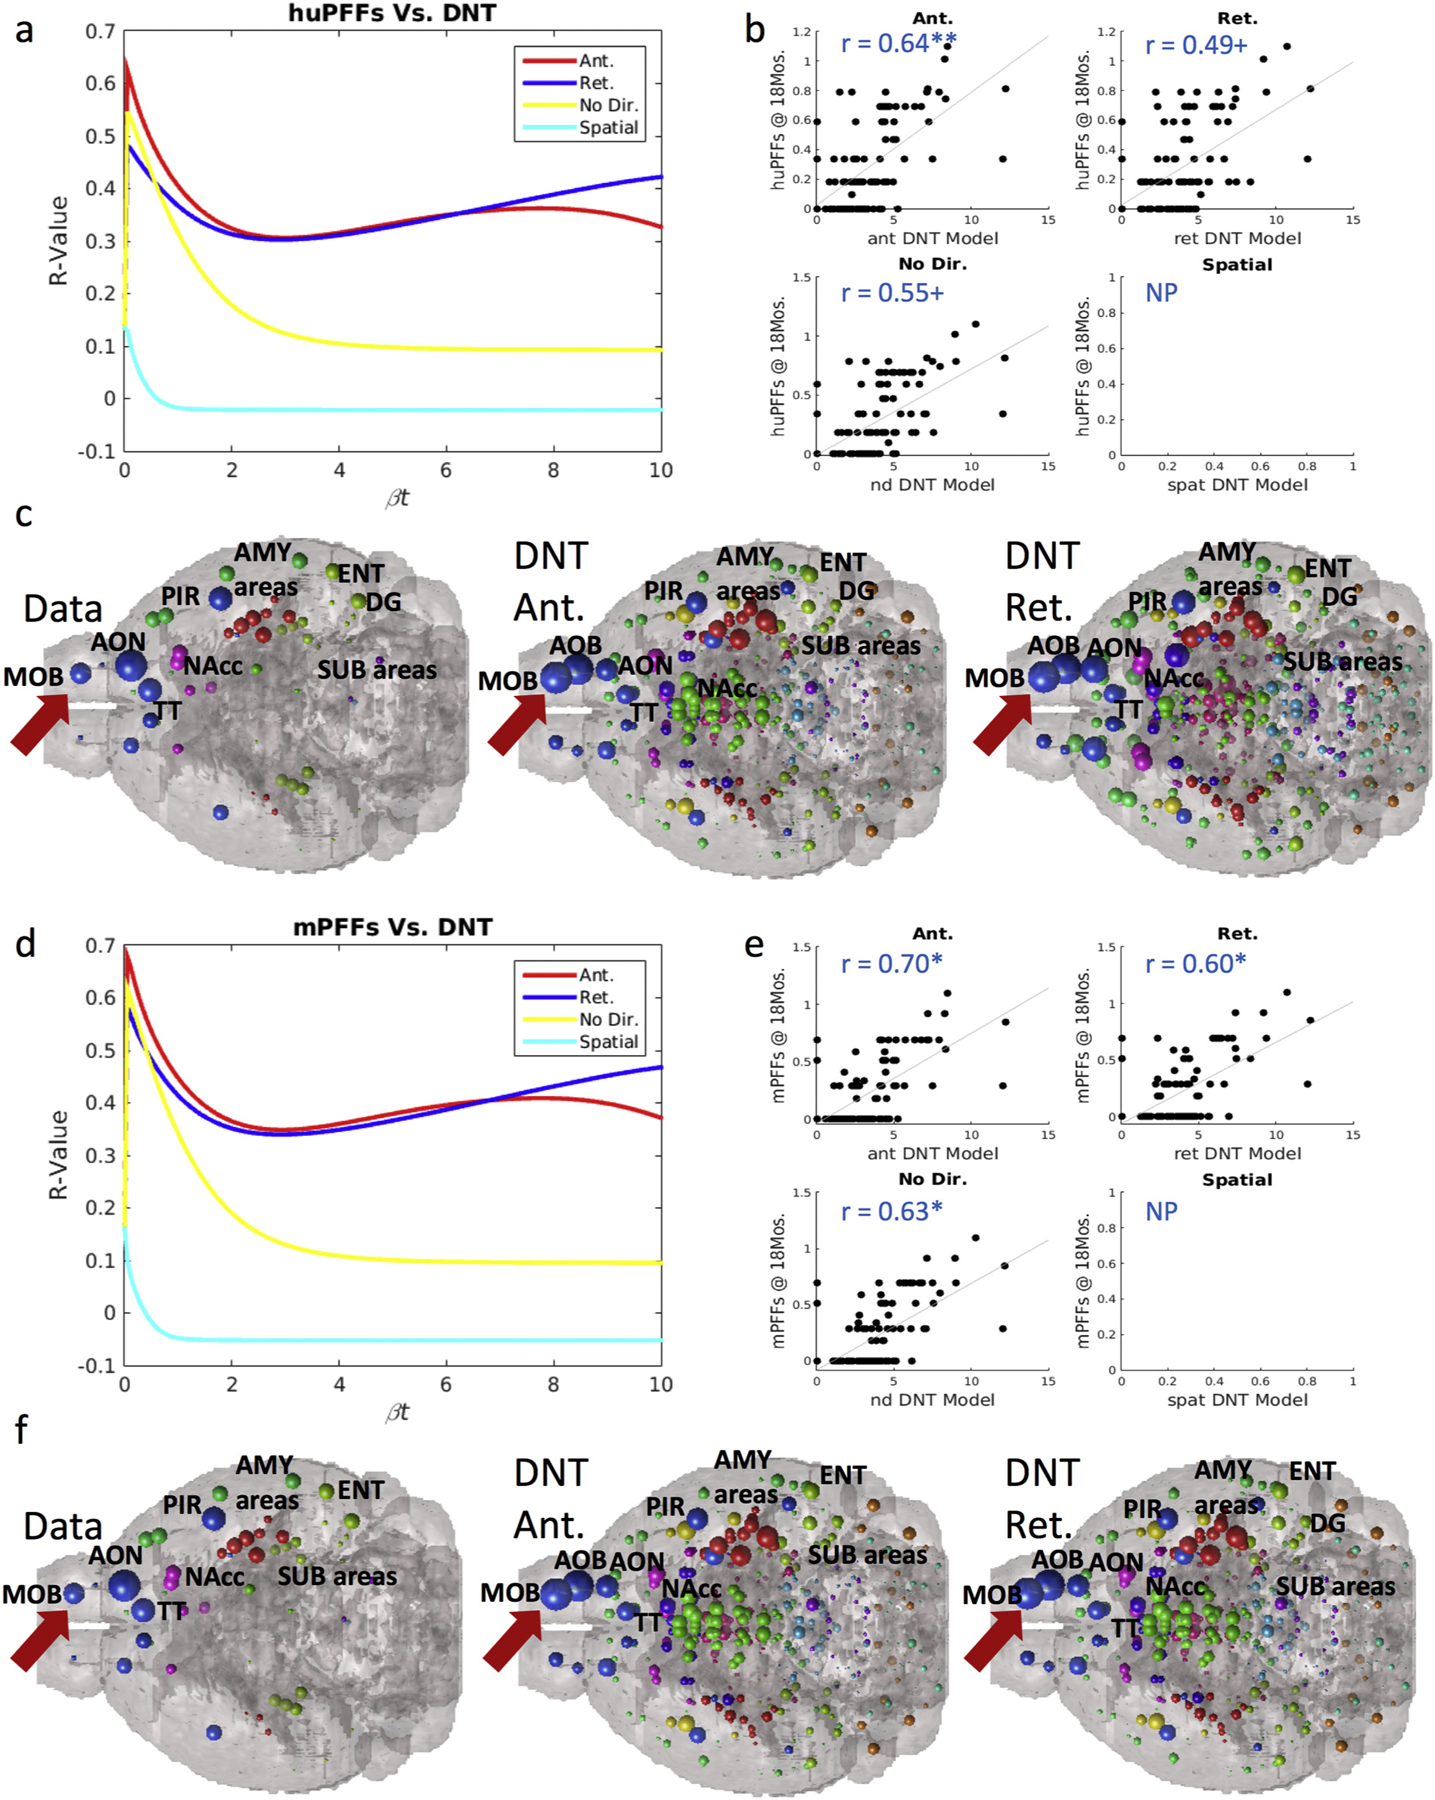
At 18-months post injection, we find the same phenomenon of strong inclusion pattern recreation by our anterograde DNT model at timepoints far from injection, and in contrast with findings at earlier measured timepoints. (a) βt-curve showing NT models’ r-value with huPFF data at 18-months post-injection at different diffusion time constants. (b) Scatterplots for each model’s prediction at the βt diffusion rate constant that maximizes r-values with regional αsyn inclusion data from huPFF injected mice. (c) An anatomical illustration of regional αsyn inclusion pattern data and anterograde and retrograde DNT model predictions for huPFF injected mice. (d) βt-curve showing NT models’ r-value with mPFF data at 18-months post-injection at different diffusion time constants. (e) Scatterplots for each model’s prediction at the βt diffusion rate constant that maximizes r-values with regional αsyn inclusion data from mPFF injected mice. (f) An anatomical illustration of regional αsyn inclusion pattern data and anterograde and retrograde DNT model predictions for mPFF injected mice. AMY = amygdala, AOB = accessory olfactory bulb, AON = anterior olfactory nucleus, DG = dentate gyrus, ENT = entorhinal cortex, MOB = main olfactory bulb, NAcc = nucleus accumbens, PIR = piriform cortex, SUB = subiculum, TT = tenia tecta. Please see Fig. 1 for color legend for the major region color scheme of the balls denoting regional αsyn inclusions. The red arrow points toward the MOB where the PFFs were injected. + p < .01, * p < .02. (For interpretation of the references to color in this figure legend, the reader is referred to the web version of this article.)
