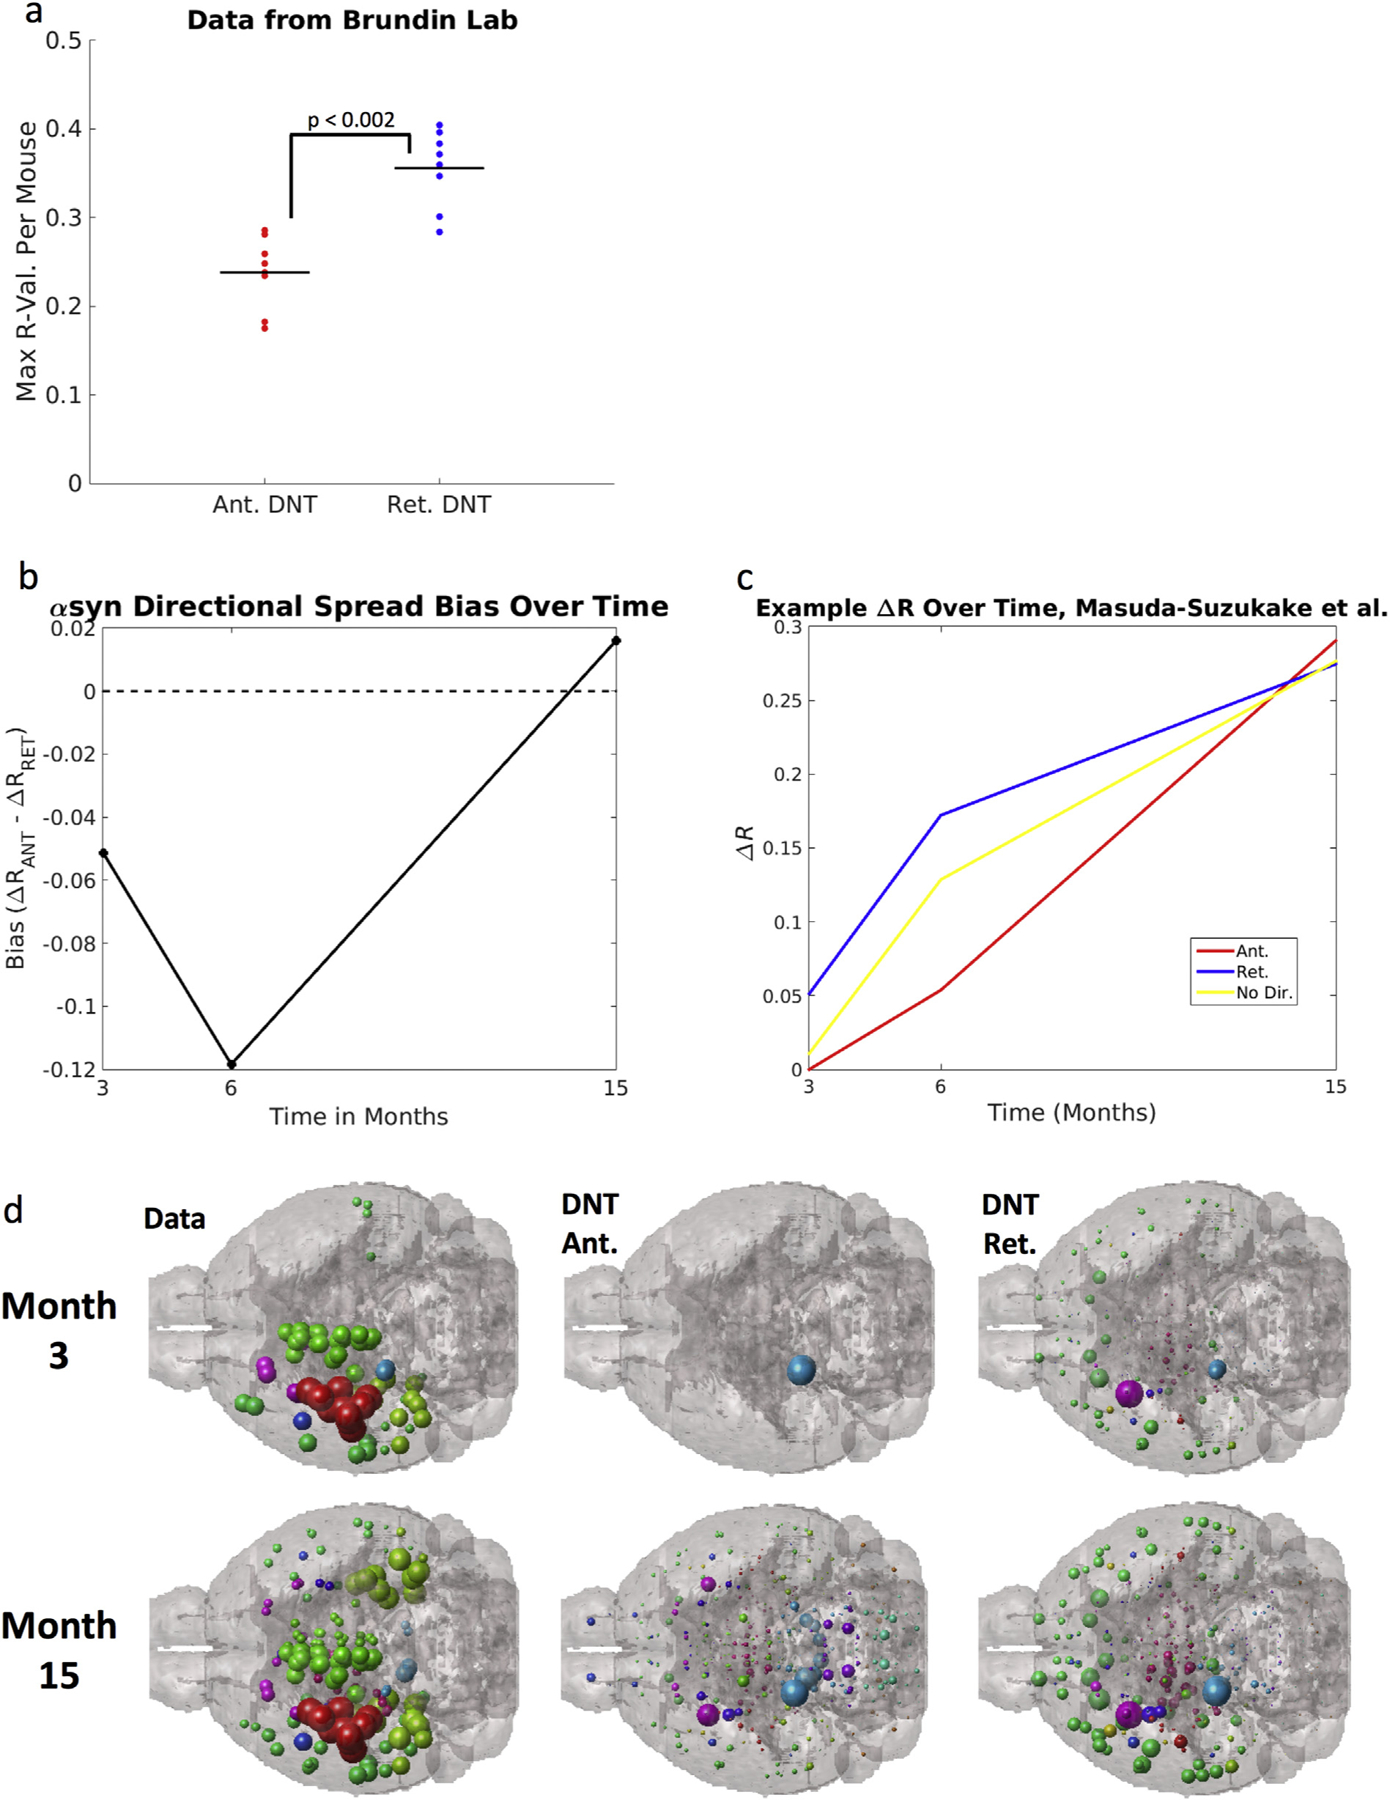
Fig. 6.

Datasets using other injection sites show the same directional shift as our data: that at timepoints surrounding the injection, synuclein inclusions are better explained by a model positing retrograde spread, but at timepoints farther form the injection, models using anterograde spread perform better. (a) Another dataset from Patrik Brundin’s lab (Chatterjee et al., 2019) using mice injected with fibrils into the striatum with regional quantification at 8-weeks post injection show the same pattern, regardless of genotype, as this early post-injection quantification of αsyn inclusions is best fit by retrograde DNT. The next panels (b,c, d) use data from (Luk and Lee, 2014): (b) Anterograde bias, calculated as in the y-axis legend above is strongest at 15-months post injection, implying that anterograde DNT, relative to retrograde DNT, performs better at later timepoints, across both ours and the Masuda-Suzukake, et al. 2013 study. A reference line at 0, the value at which there should be no directional bias, is added to the plot in (b). (c) An example, from Masuda-Suzukake, et al., 2013, showing the same switch from synuclein inclusions being best recreated by retrograde DNT at early timepoints, to being best recapitulated by anterograde DNT at later timepoints. (d) An anatomic illustration of the data and DNT simulated data from Masuda-Suzukake, et al. 2013, as in (b) & (c) above. All data and NT simulation values are log-transformed prior to running correlations. + p < .01, * p < .02.
