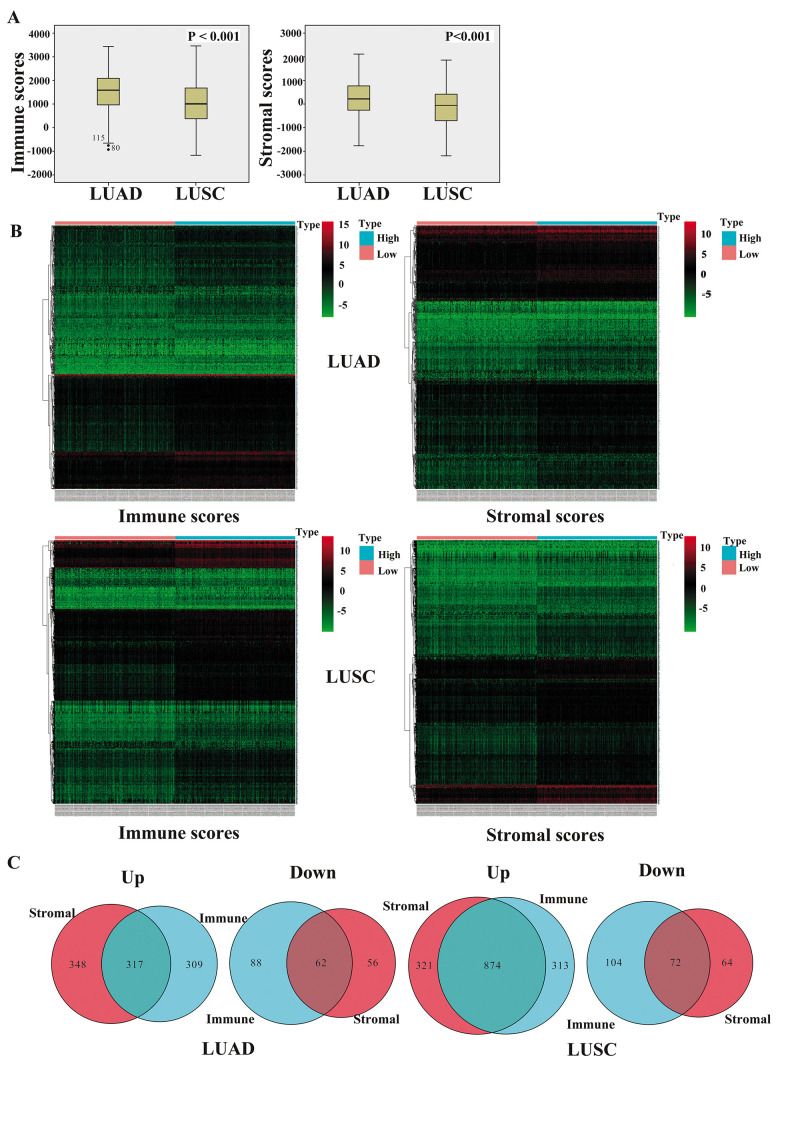
Figure 1.
Comparison of gene expression profiles with immune and stromal scores of NSCLC subtypes. (A) The box-plot shows that there is significant difference between LUAD and LUSC at the levels of the immune scores and stromal scores (P < 0.001). (B) Heatmap of significantly differentially expressed genes based on immune and stromal scores. Genes with higher expression are shown in red, those with lower expression are shown in green, and those with the same expression level are in black. All results were screened at fold change > 2, P < 0.05. (C) Venn diagram analysis of aberrantly expressed genes based on immune and stromal scores. NSCLC, non-small cell lung cancer; LUAD, lung adenocarcinoma; LUSC, lung squamous cell carcinoma.

