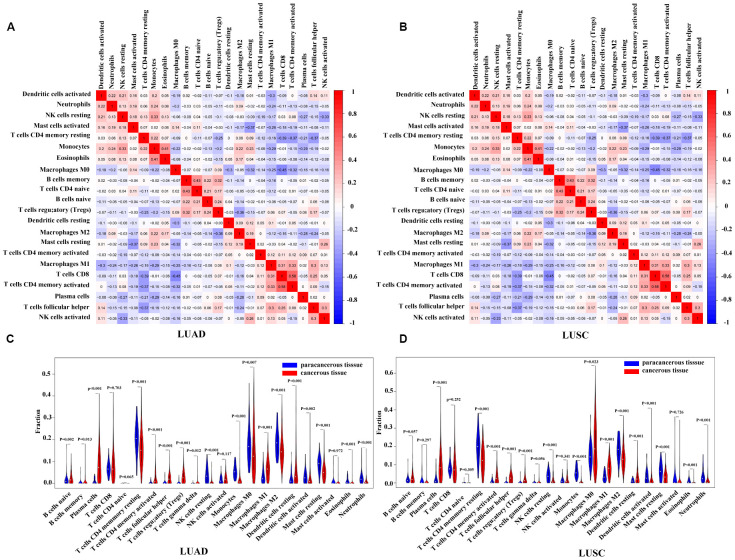
Figure 5.
Correlation matrix and violin diagrams of the proportions of all 22 subsets of TIICs. (A, B) Correlation matrix of the correlation of the infiltration of tumor immune cells with LUAD and LUSC. (C, D) Difference of immune infiltration between cancerous tissues and paracancerous tissues. P < 0.05 was considered statistically significant. TIICs, tumor-infiltrating immune cells; LUAD, lung adenocarcinoma; LUSC, lung squamous cell carcinoma.

