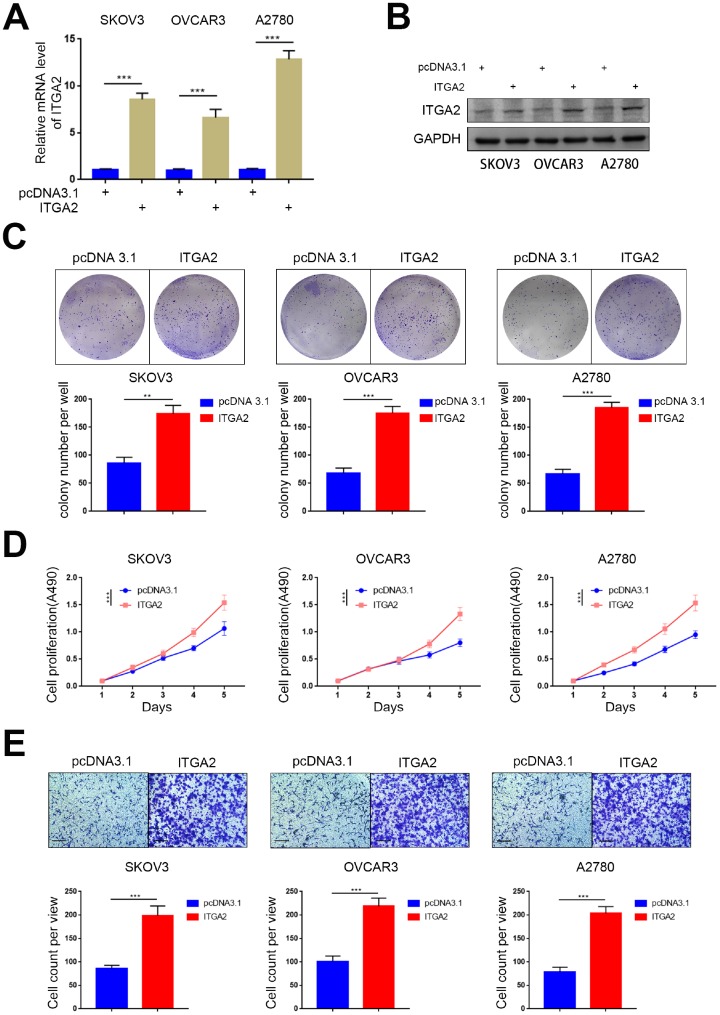
Figure 3.
Overexpressed ITGA2 promoted the aggressiveness of ovarian cancer in vitro. (A) SKOV3, OVCAR3, and A2780 cells lines with stably overexpressed ITGA2 were established. RT-PCR assay (A) and Western blot assay (B) were performed in the three cell lines. GAPDH served as an internal reference. Data presented as the mean ± SD of three independent experiments. Each sh-ITGA2 group was compared with sh-Control group. Statistical analyses were performed with one-way ANOVA followed by Tukey's multiple comparison's tests. ***, P < 0.001. (C–E) SKOV3, OVCAR3, and A2780 cells lines with stably overexpressed ITGA2 were established. The cells were harvested for colony formation assay (C), MTS assay (D), and migration assay (E). For e, representative images of migrated cells were shown based on a transwell assay. Each bar represents the mean ± SD of three to five independent experiments. Each sh-ITGA2 group was compared with sh-Control group. Statistical analyses were performed with one-way ANOVA followed by Tukey's multiple comparison's tests. **, P < 0.01; ***, P < 0.001.

