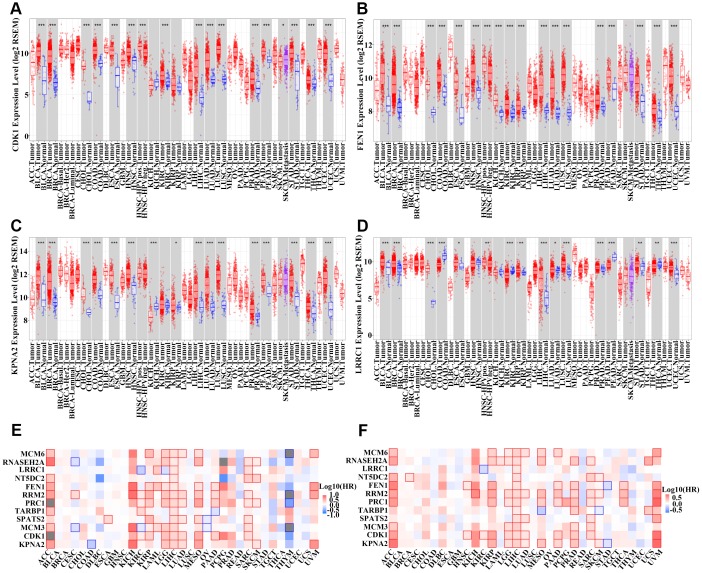
Figure 6.
Detection of the expression of 12 hub genes in other types of cancer. (A–D) Boxplot of CDK1 (A), FEN1 (B), KPNA2 (C), and LRRC1 (D) expression in different types of cancer and normal tissues from the TCGA pan-cancer cohort. (E–F) Survival analysis examining the correlation between 12 hub genes and overall survival (OS) (E) or disease-free survival (DFS) (F) among different types of cancer patients in the TCGA cohort. Red wireframe indicates statistical differences. Red and blue colors show that gene expression was negatively and positively correlated with OS/DFS, respectively.

