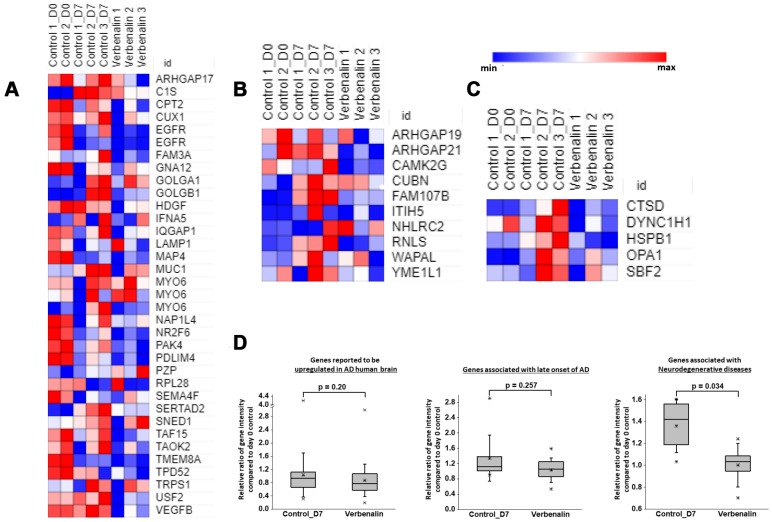
Figure 3.
Heat maps showing relative expression intensity of genes reported to be (A) upregulated in AD human brain, (B) strongly associated with late-onset of AD, (C) associated with neurodegenerative diseases in untreated control hAECs on day 0 and day 7, and in verbenalin-treated hAECs on day 7. (D) Boxplots for the relative ratios of gene intensity (genes presented in the heat maps) in day 7 control (Control_D7) and verbenalin-treated hAECs compared with day 0 control. Box ranges from 25th to 75th percentile, the line in the middle represents the median value, the whiskers represent the min, max, and mean values, and the error bar represents the SD. Significance was computed by One-way ANOVA for linear distribution and Mann-Whitney U test for nonlinear distribution. Heat maps were generated using Morpheus online tool.

