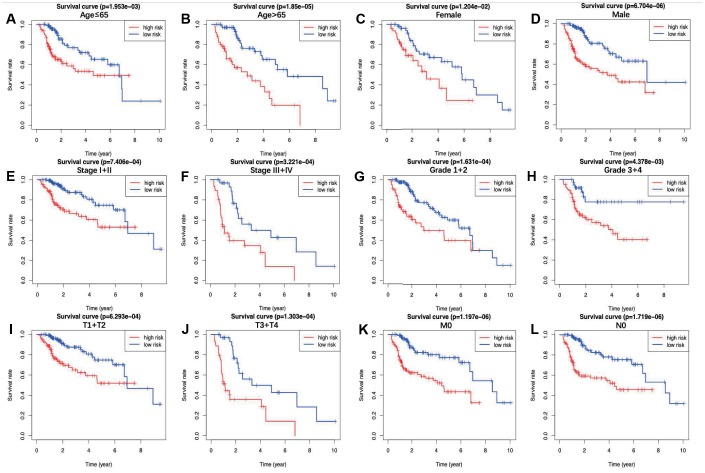
Figure 4.
The overall survival differences between the high-risk group and the low-risk group were shown under the conditions of classifying patients by age (A, B), sex (C, D), stage (E, F), grade (G, H) and T stage (I, J). Patients without distant metastasis (K) and lymph node metastasis (L) are also displayed. Detailed notes are described in the main text.

