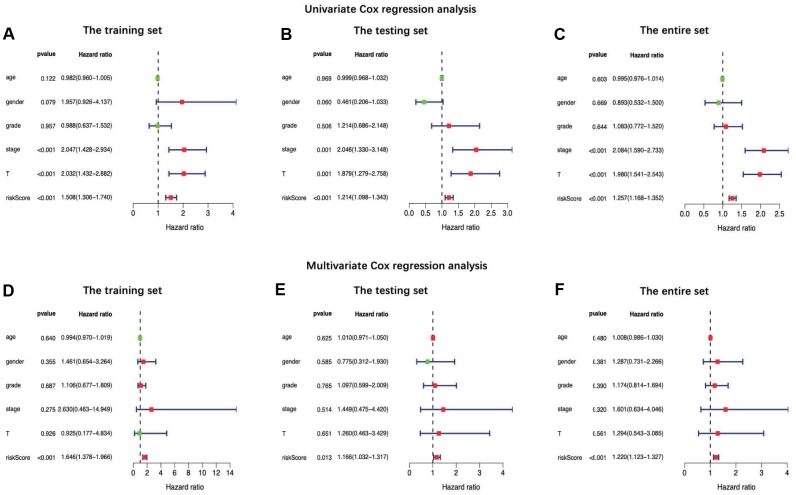
Figure 5.
Univariate (A–C) and multiple (D–F) regression analysis of hepatocellular carcinoma and the relationships between the age, gender, grade, stage, T stage, distant metastasis, lymph node metastasis and riskScore in the training set (A and D), the testing set (B and E) and the entire set (C and F). Green dot means hazard ratio (HR) median value is less than 1, red dot means HR median value is greater than 1.

