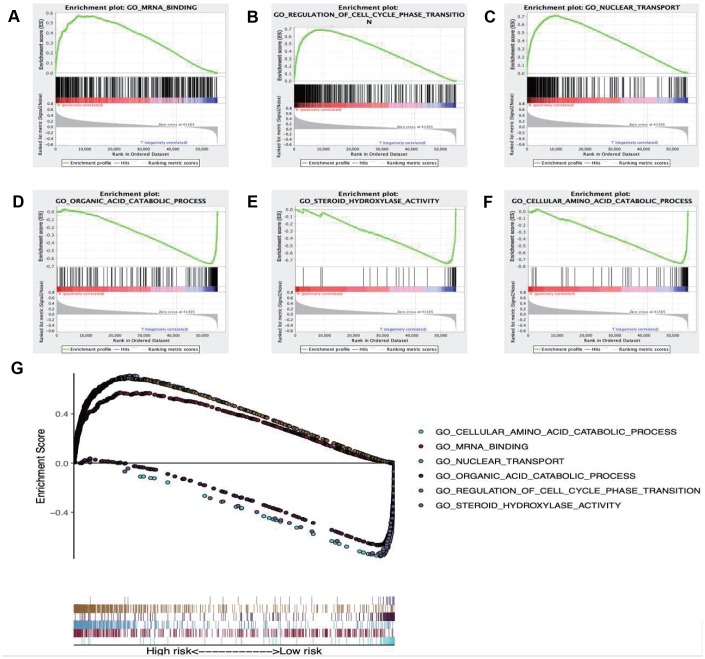
Figure 9.
Enrichment plots of Gene Ontology annotation from gene set enrichment analysis (GSEA). GSEA results showing (A) mRNA binding, (B) Regulation of cell cycle phase transition, (C) Nuclear transport were differentially enriched in high risk phenotype, while (D) Organic acid catabolic process, (E) Steroid hydroxylase activity (F) Cellular amino acid catabolic process were closely correlated with the low risk phenotype. (G) Summarizes the above six gene sets.

