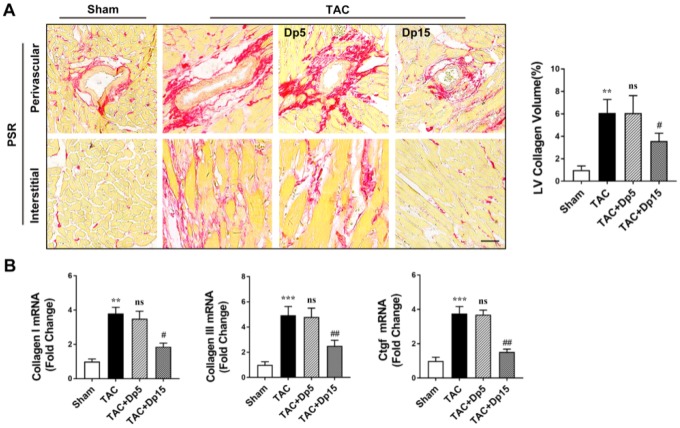
Figure 3.
Delphinidin attenuated pressure overload-induced myocardial fibrosis in vivo. (A) Left, Representative PSR staining of histological sections of the LV (n=8). Right, Statistical analysis of differences in cardiac fibrosis. (B) Quantitative real-time PCR (qRT-PCR) was performed to analyze the mRNA levels of fibrosis genes (n=5). In A–B, **p<0.01 versus the sham group; ***p<0.001 versus the sham group; ns versus the TAC group; ##p<0.01 versus the TAC group; ###p<0.001 versus the TAC group.

