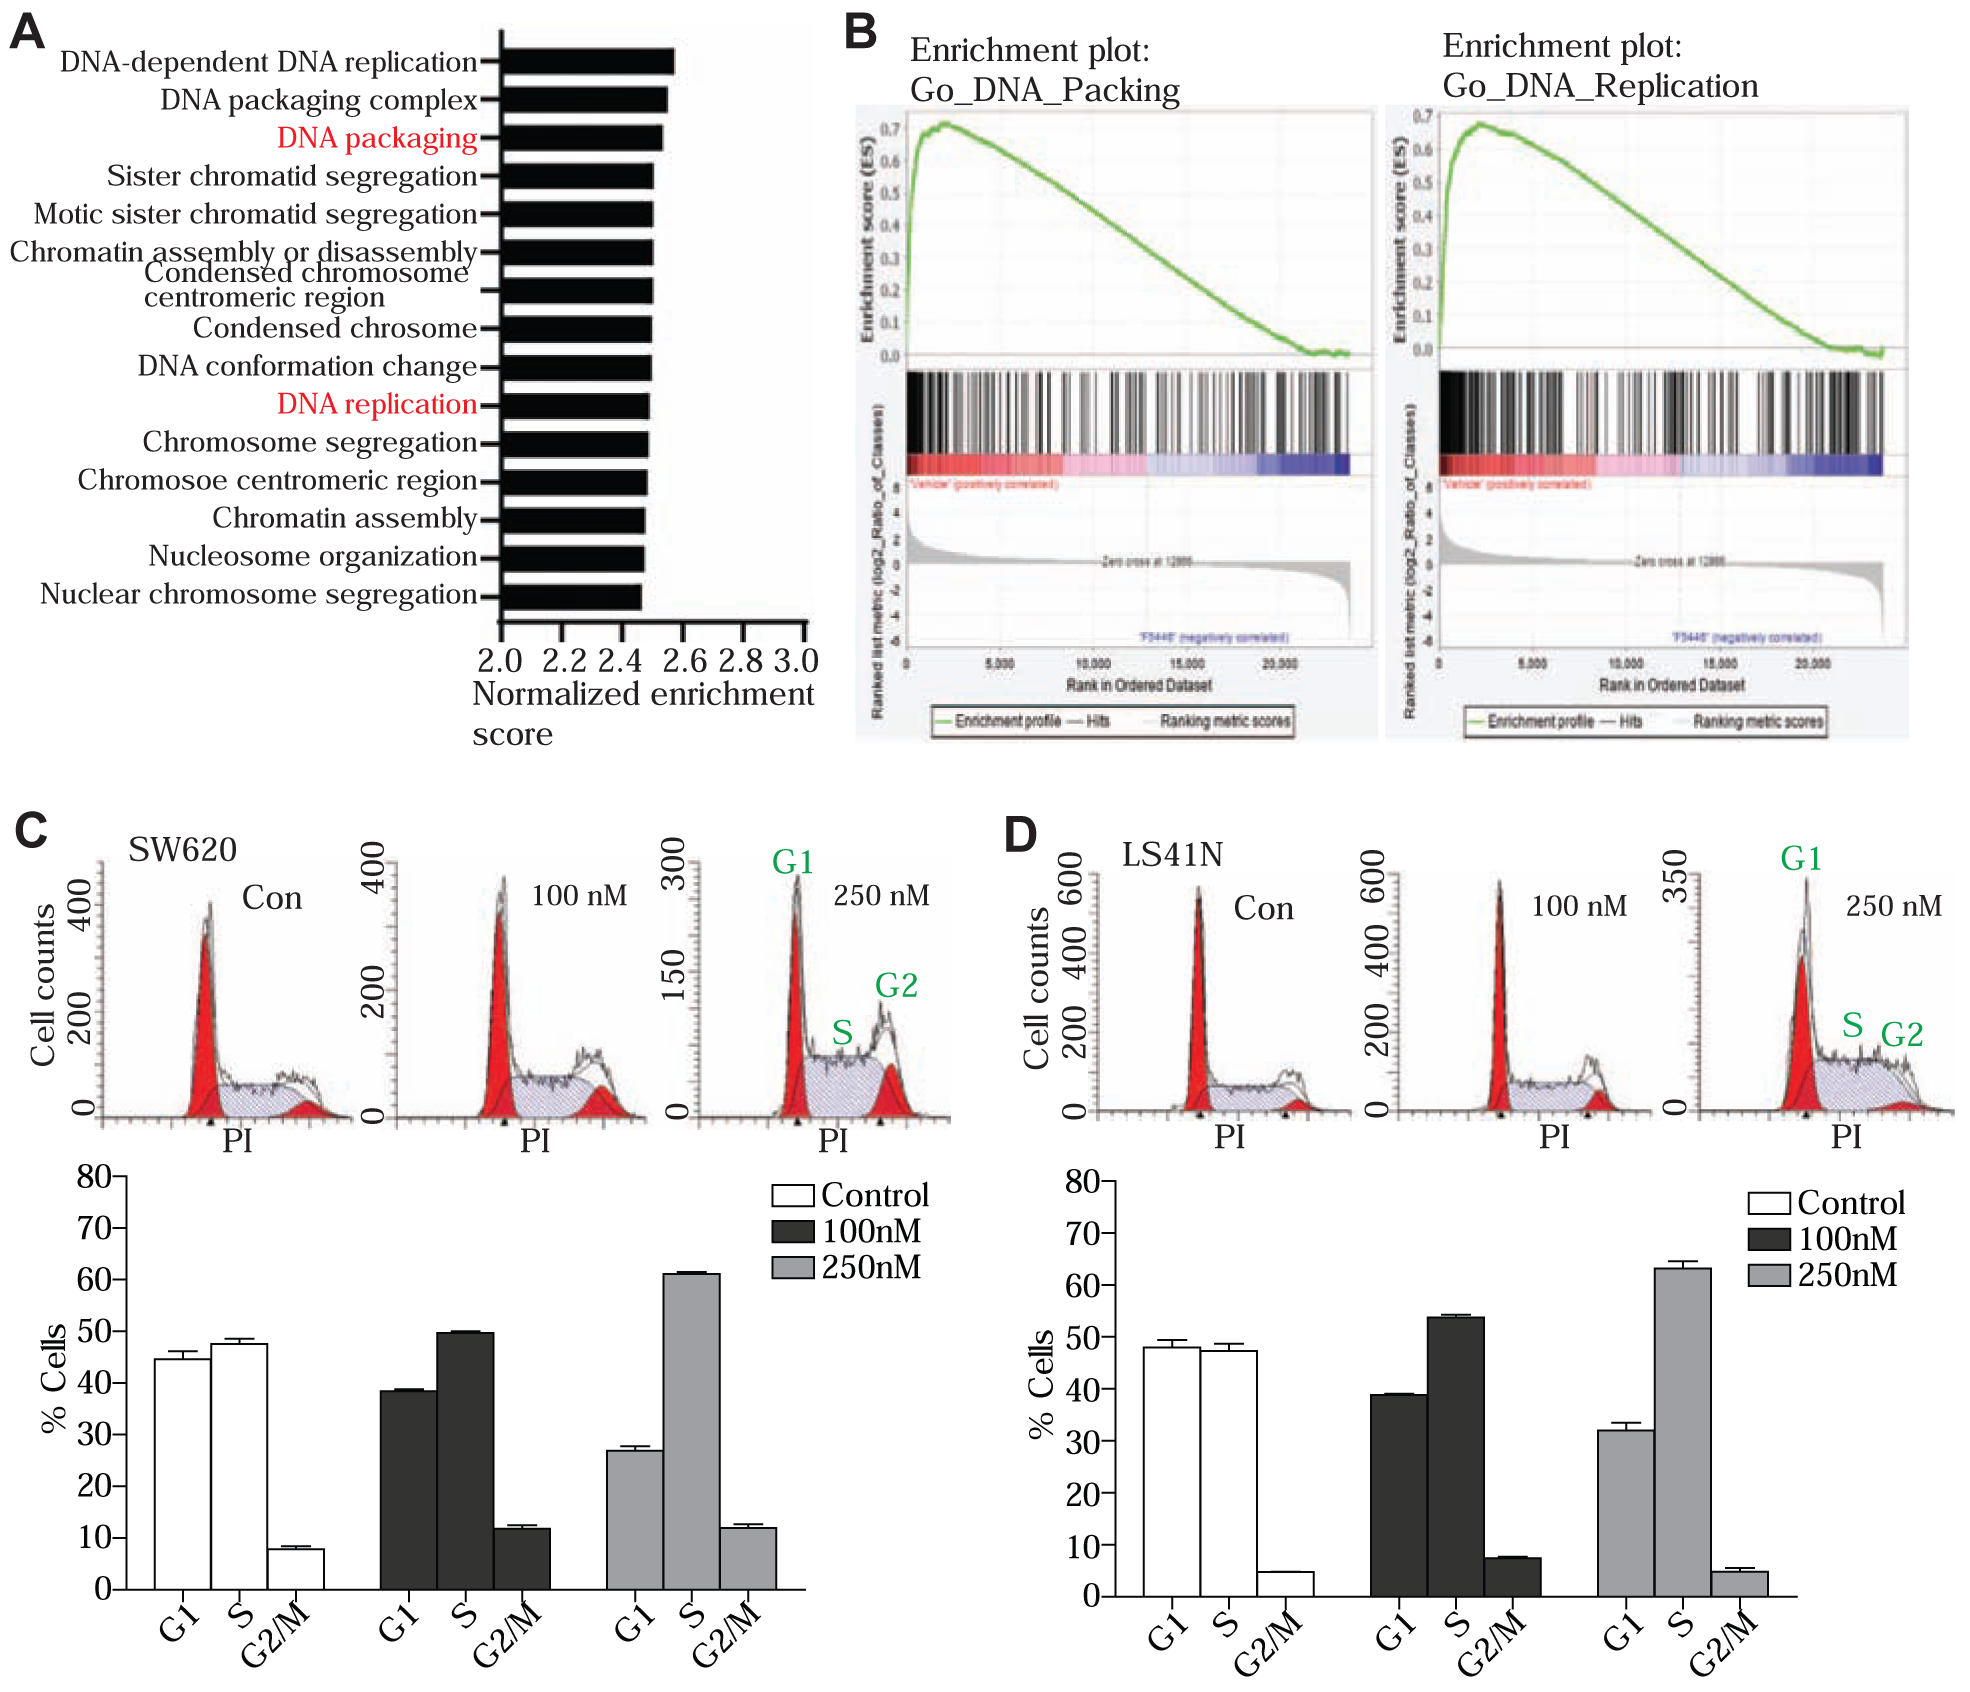
Figure 3. SUV39H1 regulates cell cycle progression in human colon tumor cells.

A. SW620 cells were treated with F5446 (500 nM) for 2 days and analyzed for genome-wide gene expression profiles by DNA microarray. The genes whose expression was changed by a 2-fold were selected and fed into the Panther program to group the genes based on their functions in biological process. Shown is the Gene Set Enrichment Analysis (GSEA) of the top fifteen Gene Ontology (GO) terms enriched in untreated cells. All GSEA false discovery rate q-values <0.0001. B. Representative enrichment plots. C. SW620 cells were treated with F5446 at the indicated concentrations for 48 hours. Cells were then fixed, stained with PI, and analyzed by flow cytometry for DNA content. Shown are representative histographs of flow cytometry data (top panel). The % cells at each phase were quantified and presented at the bottom panel. D. LS411N cells were treated and analyzed as in A. Columns, mean; bars, SD. Shown are representative data of one of two experiments.
