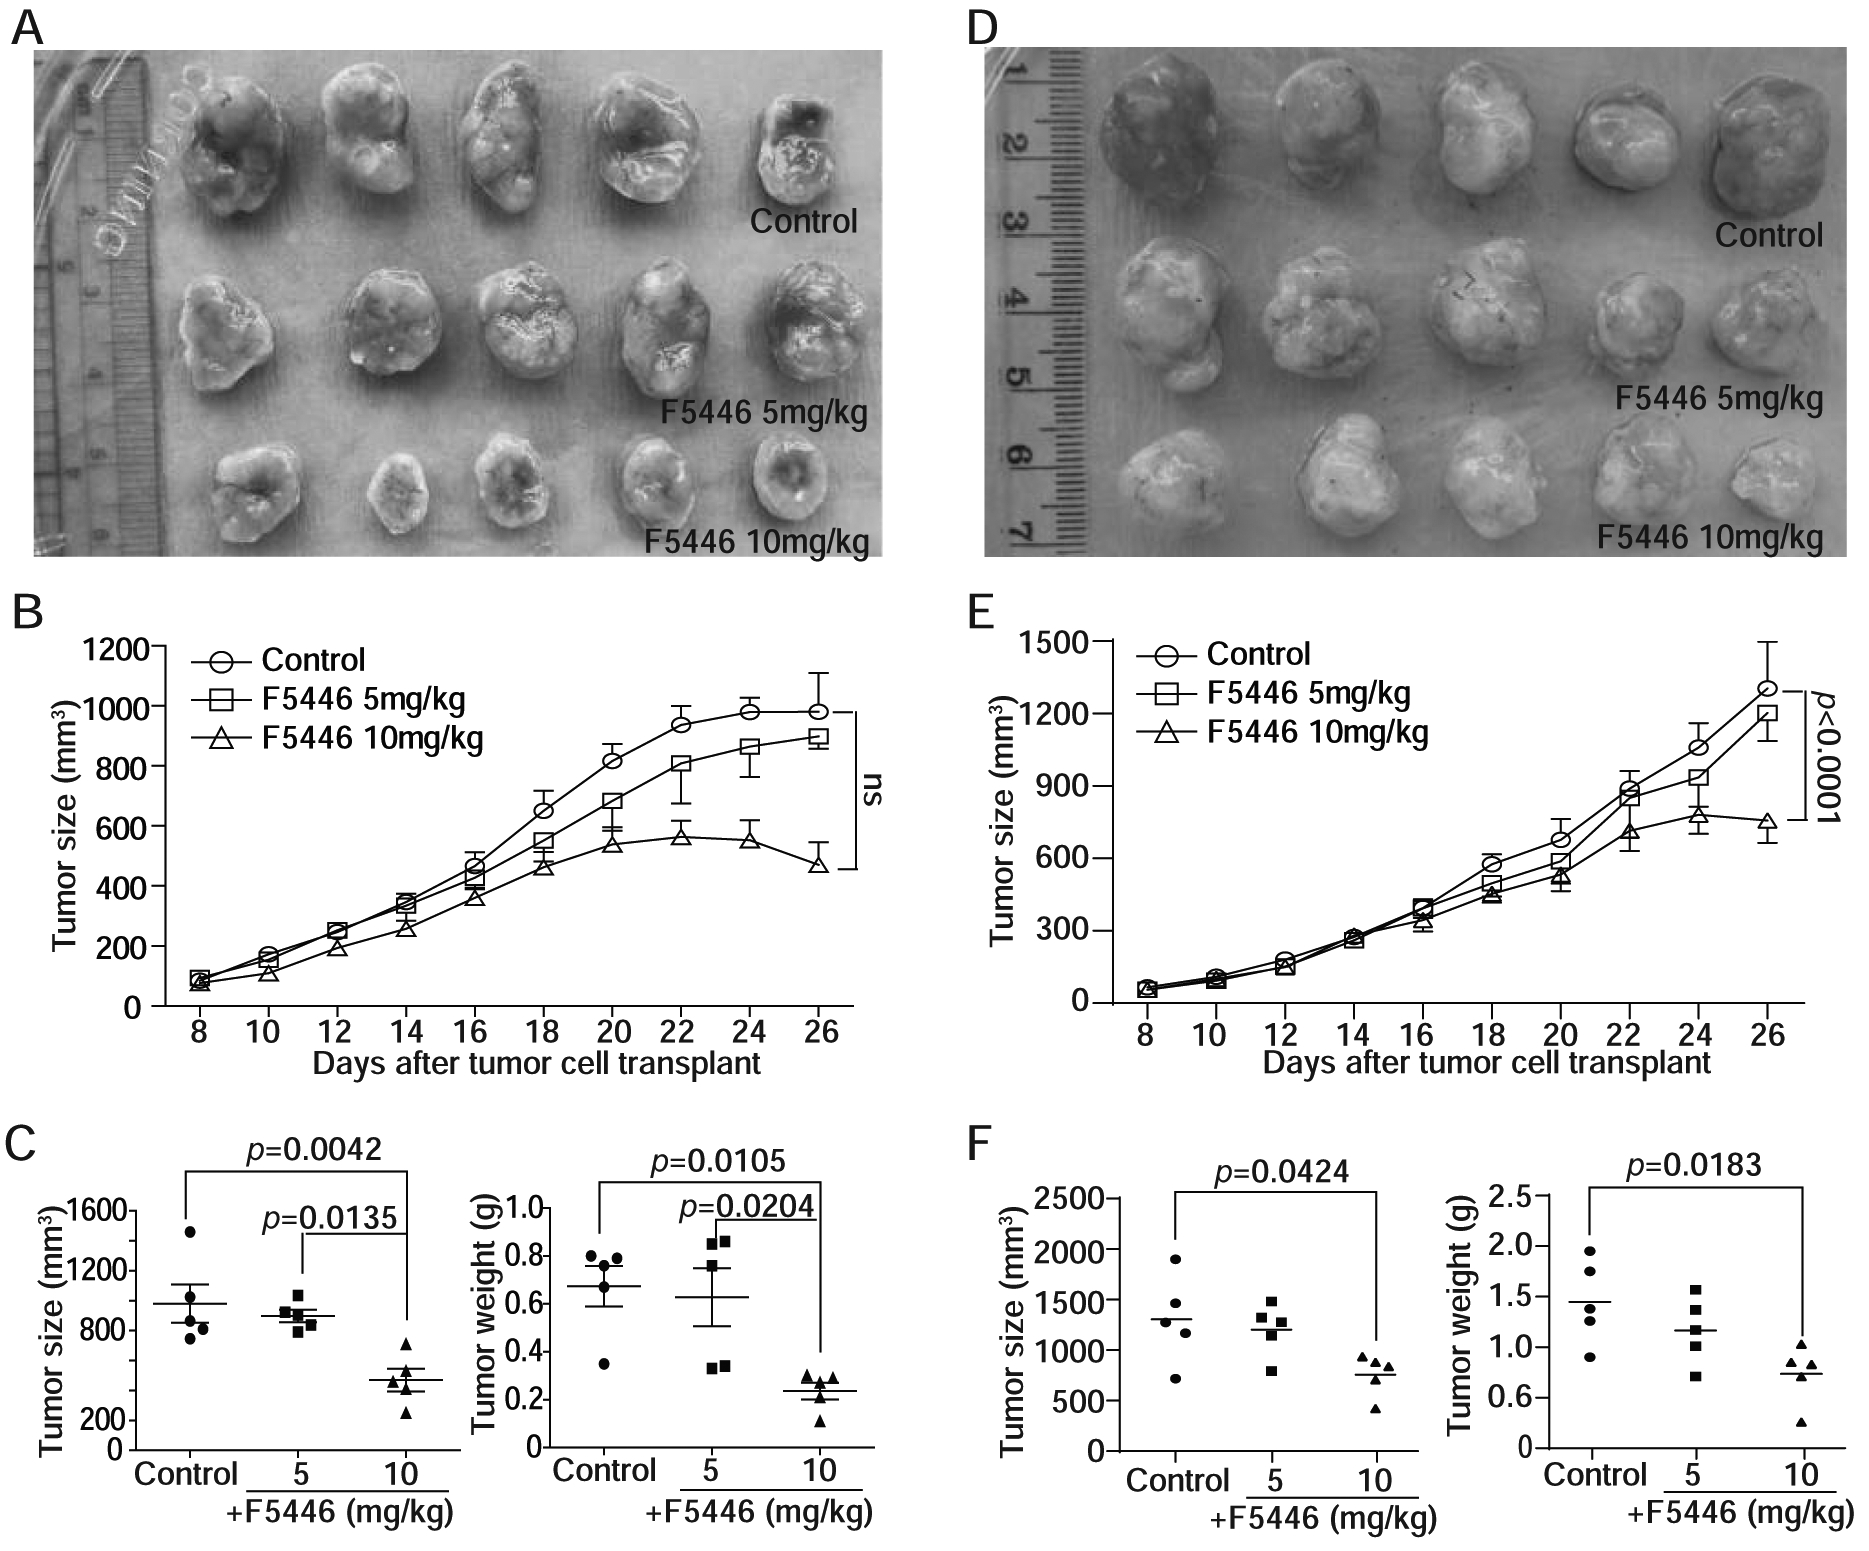
Figure 7. F5446 suppresses human colon tumor xenograft growth in vivo.

A. SW620 cells (2.5 × 10⁶ cells/mouse) were injected subcutaneously into the right flanks of twenty athymic mice, Fifteen tumor-bearing mice with relative similar sizes of tumors were selected at day 8 after tumor cell injection and randomly grouped into three groups. The mice were then treated with solvent (control, n=5), and F5446 at 5 (n=5) and 10 mg/kg (n=5) body weight, respectively, by intraperitoneal injection every two days for 10 times. Shown are tumor images at the end of the experiment. B. Tumor growth was monitored over time and shown in A. To examine whether growth of tumor size over 26 days between F5446 doses differed, a repeated-measures mixed model was used with a Kenward-Rodger adjustment to the denominator degrees of freedom and an unstructured correlation matrix to model the correlation within animal between measurement days. C. The tumor size and weight at the end of the experiment were quantified. To determine differences in tumor size and weight at the end of the experiment between control and treatment groups, one-way ANOVA was used with a Tukey-Kramer multiple comparison test if the overall F-test was statistically significant. The p values are shown at the top. D. SW620–5FUR cells (2.5 × 10⁶ cells/mouse) were injected subcutaneously into the right flanks of fifteen athymic mice, The tumor-bearing mice were randomly grouped into three groups. The mice were then treated as in A. E. Tumor growth was monitored over time and shown in D. Tumor growth kinetics were analyzed by statistical tools as in B. The p value is shown at the right. F. The tumor size and weight at the end of the experiment were quantified. The differences in tumor size and weight at the end of the experiment were analyzed as in C. The p values are shown at the top.
