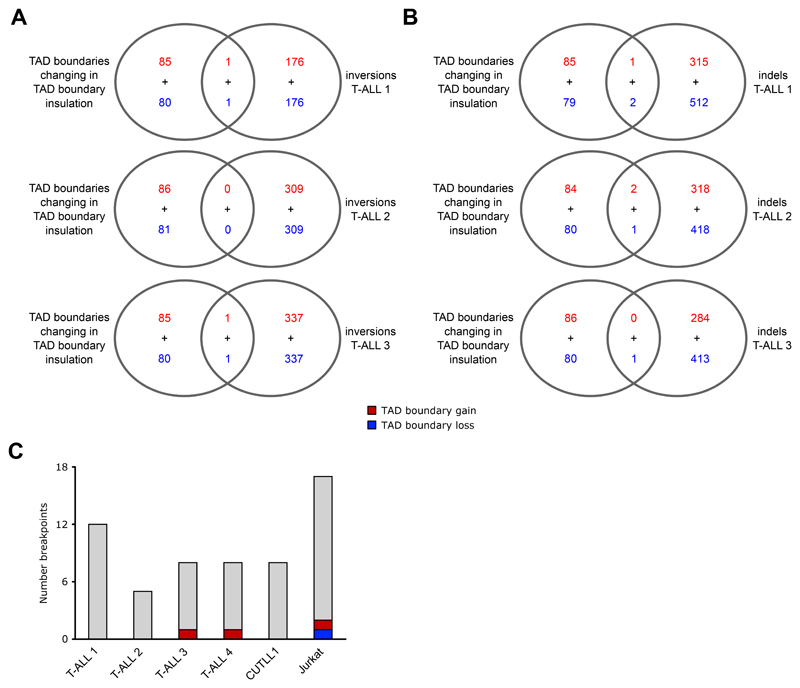
Extended Data Fig. 4. WGS integration with TAD boundaries altered in T-ALL.
A+B) Overlap of altered TAD boundaries as in Figure 3C and 3D with genomic inversions (A) or insertions/deletions (indels) (B) from WGS of T-ALL 1 (top) and T-ALL 2 (bottom). Overlap was determined by bedtools intersect, using a 1bp overlap for indels and 100kb for individual inversion breakpoints (instead of the entire genomic range affected by the inversion).
C) Overlap of individual translocation breakpoints (calculated from T-ALL Hi-C samples as in Supplementary Fig. 1B) with TAD boundaries displaying changes in TAD insulation between T cells and T-ALL. Overlap was determined by bedtools intersect, using a 1bp overlap.

