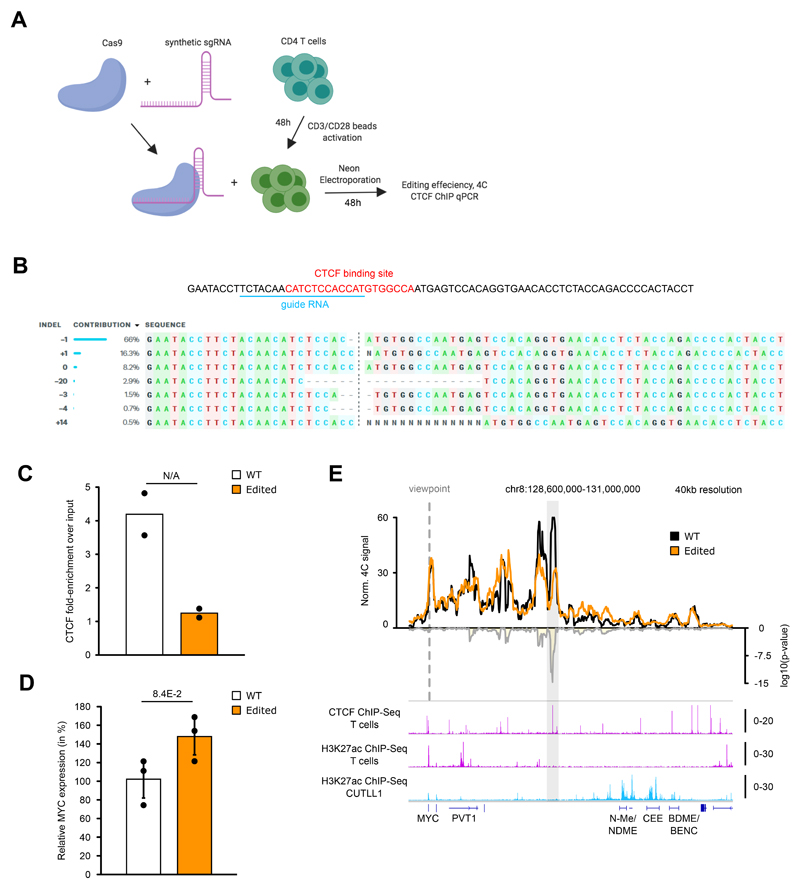
Extended Data Fig. 7. CRISPR-Cas9 deletion of CTCF binding site shows loss of insulation around MYC locus.
A) Schematic of Cas9+Synthetic guide transfection of activated T cells.
B) Sequence showing CTCF motif in the insulator region in T cells targeted for CRISPR-based deletion. sgRNA targeting sequence within the CTCF motif is highlighted. Sequencing of sgRNA target site indicates various indels along with frequencies observed for each indel.
C) CTCF ChIP-qPCR validation of reduced CTCF binding in edited T cells compared to unedited T cells (n = 2 replicates).
D) qPCR comparing MYC expression in edited T cells compared to unedited T cells (n = 3 replicates). Statistical significance was determined using unpaired two-sided t test. Error bars indicate s.d.; center value indicates mean.
E) 4C-seq analysis using MYC promoter as viewpoint in edited and unedited T cells. Positive y-axis shows interactions with the viewpoint as normalized read counts, negative y-axis shows significance of differential interactions between the two samples as log10(P value) calculated with edgeR function glmQLFTest. Tracks below show CTCF ChIP-seq in CUTLL1 and H3K27ac ChIP-seq in naïve T cells and CUTLL1 as fold-enrichment over input. Number replicates: T cells WT 4C n = 2; T cells Edited 4C n = 2; T cells CTCF n = 2; T cells H3K27ac n = 2; CUTLL1 H3K27ac n = 2.

