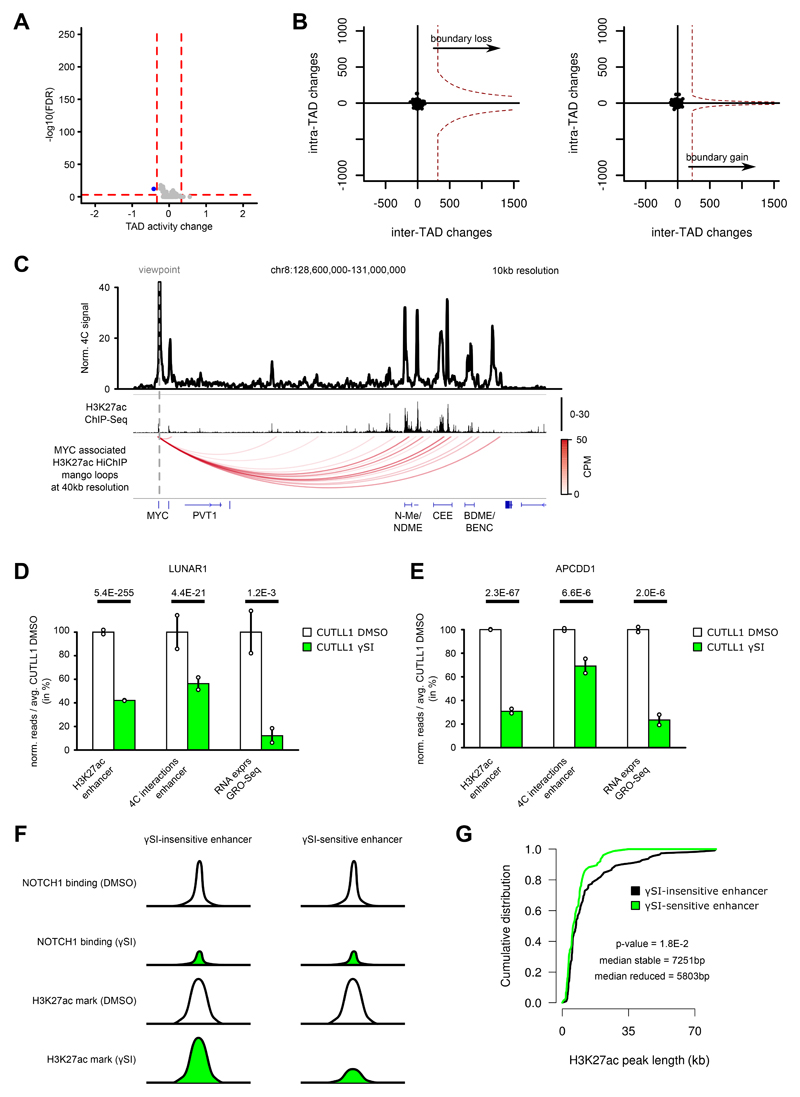
Extended Data Fig. 8. Genome-wide Hi-C analysis in T-ALL following γSI shows no intra-TAD activity differences, but individual promoter-enhancer loops are disrupted.
A) Volcano plot showing differential intra-TAD activity between CUTLL1 DMSO vs CUTLL1 γSI (average activity > 0.58 / < -0.58 and with FDR < 0.05). Statistical evaluation was performed using paired two-sided t test between all per bin-interactions between DMSO and γSI (n = 2 replicates).
B) Representation of TAD boundary alteration events (red dots; none identified). Plots depict pair-wise comparisons for TAD boundary losses of adjacent CUTLL1 (untreated, left) TADs and for TAD boundary gains of adjacent CUTLL1 (γSI treated, right) TADs. Dotted line represents outlier threshold as in Figure 3 C) and D).
C) Virtual 4C of H3K27ac HiChIP in CUTLL1, using MYC promoter as viewpoint (chr8: 128,747,680), showing edgeR-normalized CPM. H3K27ac ChIP-seq track for MYC locus shown as fold-enrichment over input. Detected significant loops as arc-representation (below) from mango pipeline utilizing two-sided binomial test per matrix-diagonal followed by multiple testing correction 63 (FDR<0.1; CPM>5). Number replicates: CUTLL1 H3K27ac HiChIP n = 1; CUTLL1 H3K27ac ChIP-seq n = 2.
D) H3K27ac signal (enrichment over input) (left), chromatin interaction of the highest peak by 4C-seq (center) for the interaction of LUNAR1 promoter with its upstream enhancer and LUNAR1 expression (right). All quantifications are normalized to the respective average T cell signal, shown in percent. Significance of differences was calculated using diffBind with edgeR-method (for H3K27ac ChIP-seq, FDR) and edgeR (for 4C-seq interactions and GRO-seq as P value and FDR respectively). Error bars indicate s.d.; center value indicates mean. Number replicates: CUTLL1 DMSO H3K27ac n = 2; CUTLL1 γSI H3K27ac n = 2; CUTLL1 DMSO 4C n = 2; CUTLL1 γSI 4C n = 2; CUTLL1 DMSO GRO-seq n = 2; CUTLL1 γSI GRO-seq n = 2.
E) H3K27ac signal (left), chromatin interaction of the highest peak by 4C-seq (center) for the interaction of APCDD1 enhancer with the downstream APCDD1 promoter and APCDD1 expression (right). All quantifications are normalized to the respective average T cell signal, shown in percent. Significance of differences was calculated using diffBind with edgeR-method (for H3K27ac ChIP-seq, FDR) and edgeR (for 4C-seq interactions and GRO-seq as P value and FDR respectively). Error bars indicate s.d.; center value indicates mean. Number replicates: CUTLL1 DMSO H3K27ac n = 2; CUTLL1 γSI H3K27ac n = 2; CUTLL1 DMSO 4C n = 2; CUTLL1 γSI 4C n = 2; CUTLL1 DMSO GRO-seq n = 2; CUTLL1 γSI GRO-seq n = 2.
F) Schematic of γSI sensitive and insensitive enhancer.
G) Peak width of stable (black; n = 111) or decreased H3K27ac signal (green, n = 76) as defined in Figure 5A. Significant difference between the distributions is estimated by a two-sided Wilcoxon test. Number replicates: CUTLL1 DMSO H3K27ac n = 2; CUTLL1 γSI H3K27ac n = 2.

