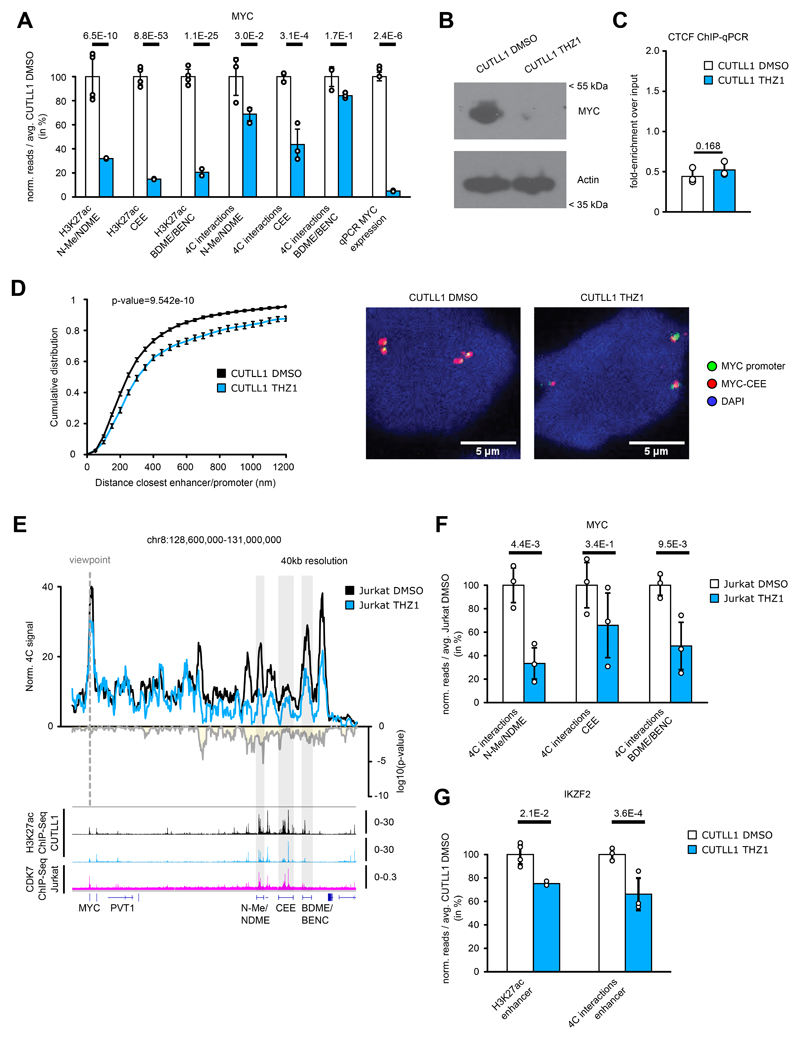
Extended Data Fig. 10. Treatment of T-ALL with THZ1 reduces also γSI insensitive promoter-enhancer interactions.
A) H3K27ac signal is specific for N-Me/NDME, CEE and BDME/BENC. Interaction changes are measured by centering the 40kb bin on highest peaks within N-Me/NDME, CEE or BDME/BENC elements. MYC expression after THZ1 treatment was measured by qPCR. All quantifications are normalized to the average CUTLL1 DMSO signal, shown in percent. Error bars indicate s.d.; center value indicates mean. Significance is shown as false-discovery rate (FDR) for H3K72ac signal (R package DiffBind with edgeR-method), P value for chromatin interaction (edgeR function glmQLFTest) or two-sided t test for qPCR expression.
B) Cropped western blot images immunoblotted with MYC antibody. Unprocessed western blots can be found as Source Data. Experiment was repeated twice with similar results.
C) CTCF ChIP-qPCR, shown as enrichment over input, of CTCF site in lost boundary in MYC locus (n = 3). Error bars indicate s.d.; center value indicates mean. Significance was calculated using unpaired two-sided t test.
D) Inter-probe distance between MYC promoter and MYC-CCE measured by DNA-FISH analysis. Statistical difference between distributions of probe distances was calculated using two-sample one-sided Kolmogorov Smirnov test. Error bars indicate s.d.; center value indicates median. Probe-pairs CUTLL1 DMSO = 2001. Probe-pairs CUTLL1 THZ1 = 1308. Median distance CUTLL1 DMSO = 264.28μm. Median distance CUTLL1 THZ1 = 321.69μm.
E) 4C-seq using MYC promoter as viewpoint in Jurkat cells. Positive y-axis shows normalized interaction strength with the viewpoint, negative y-axis shows significance of differential interactions as log10(P value) calculated using edgeR function glmQLFTest (n = 3).
F) Interaction changes are measured by centering the 40kb bin on N-Me/NDME, CEE or the BDME/BENC. Error bars indicate s.d.; center value indicates mean. Significance is shown as P value for chromatin interaction changes (edgeR function glmQLFTest).
G) Quantification of changes in H3K27ac signal (enrichment over input) and chromatin interactions of IKZF2 enhancer in CUTLL1. All quantifications are normalized to the average CUTLL1 DMSO signal, shown in percent. Error bars indicate s.d.; center value indicates mean. Significance is shown as false-discovery rate (FDR) for H3K72ac signal change (R package DiffBind with edgeR-method), P value for chromatin interaction change (edgeR function glmQLFTest).

