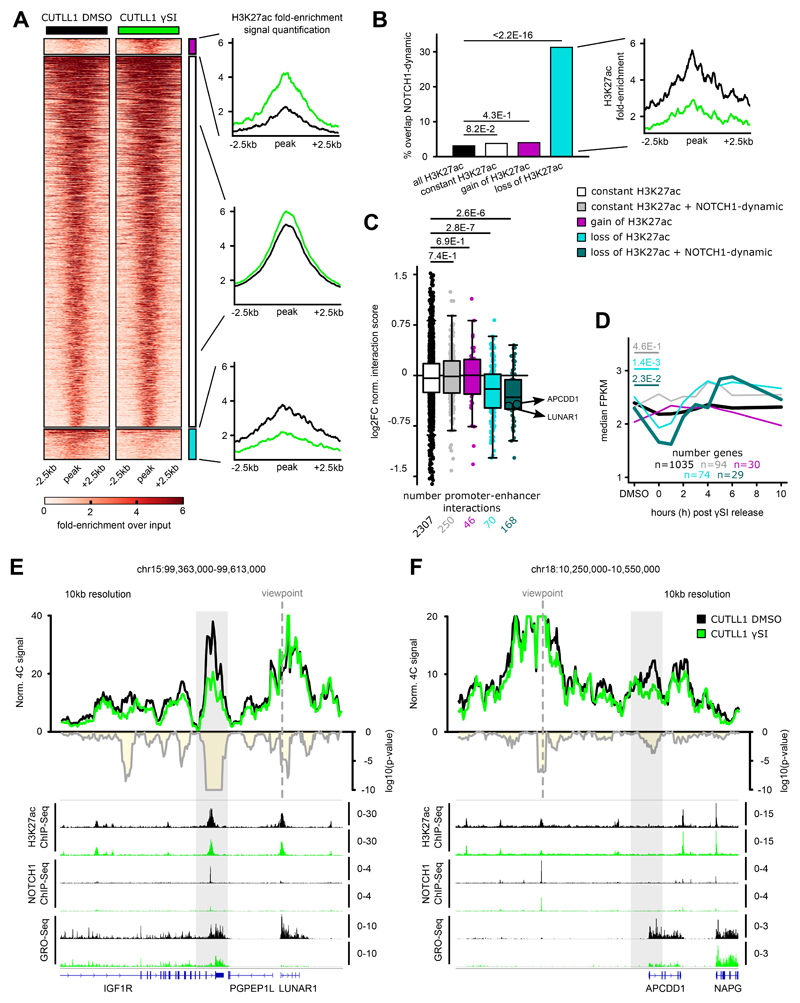
Fig. 5. NOTCH1 inhibition affects promoter-enhancer looping specifically of NOTCH1-dependent enhancers.
A) H3K27ac occupancy in CUTLL1 with and without NOTCH1-inhibitor γSI. Groups consist of stable (middle, black, n = 2,949), increased (upper, pink, n = 125) and reduced non-promoter H3K27ac signal (lower, light-blue, n = 243). Heatmap shows the H3K27ac signal as fold-enrichment over input and line plots depict quantification of H3K27ac signal, both created with DeepTools 62. Differential analysis was performed with the R package DiffBind with edgeR-method and differential peaks were selected using FDR < 0.05, log2 fold-change > 1.0 or < -1.0 (number replicates: CUTLL1 DMSO n = 4; CUTLL1 γSI n = 2).
B) Overlap of constant, increased and reduced H3K27ac peaks with previously defined NOTCH1-dynamic sites 21. Quantification of H3K27ac signal shown as fold-enrichment over input (right panel) for peaks with reduced H3K27ac signal and dynamic NOTCH1 binding (n = 76). Statistical evaluation was performed using two-sided Fisher test against all non-coding H3K27ac peaks overlapping dynamic NOTCH1 binding.
C) Changes in chromatin interactions upon γSI between non-promoter H3K27ac peaks defined in A) and B) and connected gene promoters are shown as log2 fold-change of averaged normalized interaction scores (average of n = 2 biological replicates). Each dot represents a promoter-enhancer interaction defined by H3K27ac HiChIP in CUTLL1. Significance of shifts of gene expression compared to enhancer-promoter loops of stable enhancers is calculated using an unpaired one-sided t test, following the hypothesis of a positive correlation between enhancer activity and promoter-looping.
D) Gene expression upon γSI for all genes defined in C) are shown as log2 fold-change of FPKM calculated from GRO-seq data. Significance of differences compared to genes associated with stable H3K27ac signal is calculated using an unpaired one-sided t test, following the hypothesis of a positive correlation between promoter-enhancer looping and gene expression.
E+F) 4C-seq using LUNAR1 promoter (E) or APCDD1 enhancer (F) as viewpoints. Positive y-axis shows interactions with the viewpoint as normalized read counts, negative y-axis shows significance of differential interactions between untreated and γSI treated CUTLL1 as log10(P value) calculated using edgeR function glmQLFTest. Tracks below show H3K27ac and NOTCH1 ChIP-seq and GRO-seq (positive strand only) as fold-enrichment over input where applicable, counts-per-million otherwise. Number replicates: CUTLL1 DMSO 4C LUNAR1 n = 2; CUTLL1 γSI 4C LUNAR1 n = 2; CUTLL1 DMSO 4C APCDD1 n = 2; CUTLL1 γSI 4C APCDD1 n = 2; CUTLL1 DMSO H3K27ac n = 2; CUTLL1 γSI H3K7ac n = 2; CUTLL1 DMSO NOTCH1 n = 1; CUTLL1 γSI NOTCH1 n = 1; CUTLL1 DMSO GRO-seq n = 2; CUTLL1 γSI GRO-seq n = 2.

