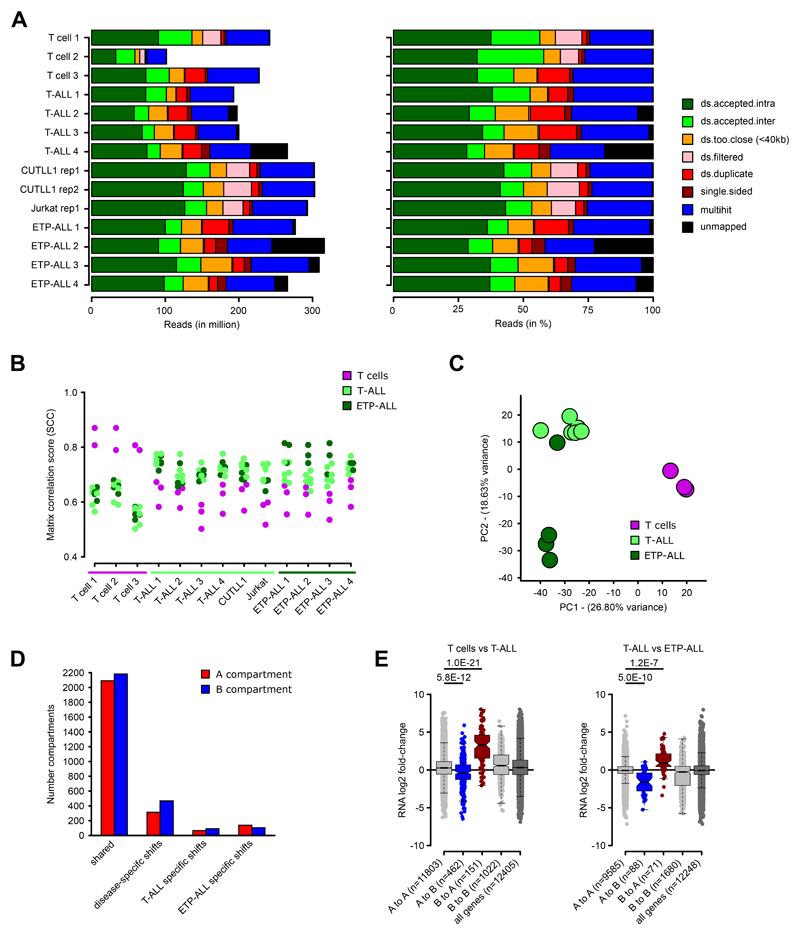
Extended Data Fig. 1. Hi-C quality control and unsupervised analyses.
A) Read alignment statistics for Hi-C datasets, as absolute reads (left) and relative reads (in %, right). “ds.accepted.intra” are all intra-chromosomal reads used for all downstream analyses.
B) Genome-wide stratum-adjusted correlation coefficient (SCC) scores for all pair-wise comparisons of the Hi-C datasets. HiCRep was used to calculate chromosome-wide correlation scores, which were averaged across all chromosomes for each pair-wise comparison. The HiCRep smoothing parameter X was set to 1.0.
C) Principal Component Analysis (PCA) of the genome-wide compartment scores for each Hi-C dataset. Number samples: T cells n = 3; T-ALL n = 6, ETP-ALL n = 4.
D) Compartment shifts between T cells, T-ALL and ETP-ALL. Assignment of A compartment was done using an average c-score > 0.1 in either all T cell, T-ALL or ETP-ALL samples and B compartment with average c-score < -0.1. Significance for differences between pairwise comparisons of T cells, T-ALL and ETP-ALL was determined using a two-sided t test between c-scores, and compartment shifts were determined using P value < 0.1.
E) Integration of gene expression associated with compartment shifts for comparisons of T cell vs T-ALL (left) or T-ALL vs ETP-ALL (right) using RNA-seq (FPKM > 1). For each gene within the respective compartment bin, log2 fold-change between T cells and T-ALL (left) or between T-ALL and ETP-ALL (right) is shown. Significant differences are calculated using an unpaired one-sided t test comparing genes from A to A compartments (i.e. active compartment) with genes from A to B or B to A compartment shifts, following the hypothesis of a positive correlation between expression and compartment association.

