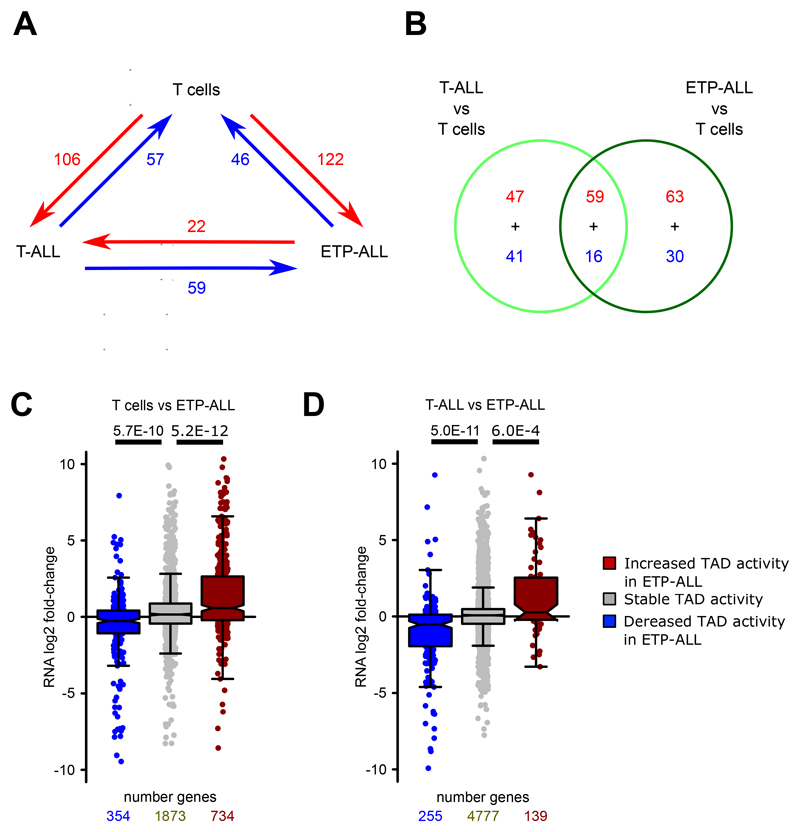
Extended Data Fig. 3. Intra-TAD activity cross-comparison of T-ALL sub-types.
A) Comparisons of intra-TAD activity between T cells, T-ALL and ETP-ALL samples.
B) Overlap of differentially active TADs between the two comparisons of T cells vs T-ALL and T cells vs ETP-ALL, visualized as venn diagram. Red and blue colors correspond to differences as highlighted in A).
C+D) Integration of RNA-seq (FPKM > 1) within TADs with decreased / increased intra-TAD activity for ETP-ALL vs T cells (C) and ETP-ALL vs T-ALL (D). For each such gene, the log2 fold-change in expression between ETP-ALL and T cells (C) / T-ALL and ETP-ALL (D) taken from RNA-seq is shown. Significant differences are calculated by an unpaired one-sided t test comparing genes from TADs with decreased / increased intra-TAD activity with genes from stable TADs, following the hypothesis of a positive correlation between expression and intra-TAD activity changes.

