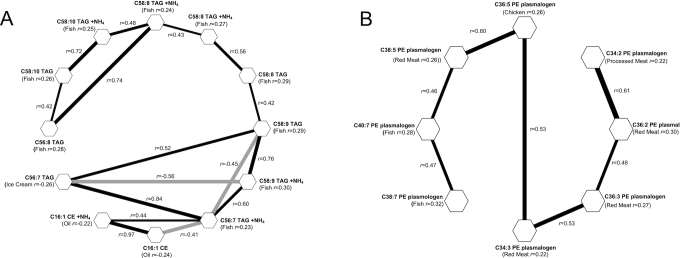
FIGURE 1.
A–B. Gaussian graphical models of 2 clusters of diet-related metabolites measured in the Prostate, Lung, Colorectal, and Ovarian Cancer Screening Trial. Metabolites are depicted as hexagons, and pairs with an absolute value of conditional correlation >0.4 are connected by a line. Black lines represent positive conditional correlations. Gray lines represent inverse conditional correlations. Clusters with <8 metabolites not shown.

