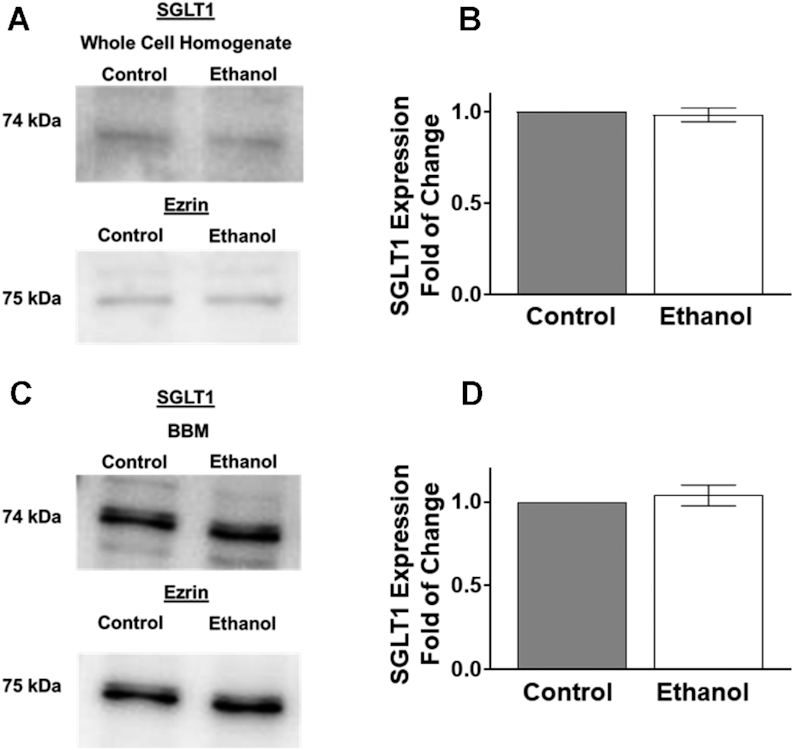
FIGURE 3.

Ethanol did not change SGLT1 protein expression in IEC-18 cells. (A) Western blot analysis of SGLT1 protein expression in whole cell homogenates from control and ethanol-treated cells. The blots show a representative sample used for densitometric quantification (n = 4). (B) Densitometric quantification of SGLT1 protein expression was not significantly changed in whole cell homogenates after 1 h exposure of ethanol (n = 4). (C) Western blot analysis of BBM protein expression of SGLT1 from control and ethanol-treated cells. The blots show a representative sample used for densitometric quantification. (D) Densitometric analysis of SGLT1 protein expression was not significantly altered in the BBM fraction after 1 h exposure to ethanol (n = 4). Values represent the means ± SEMs. Blots were normalized with an anti-ezrin antibody to assure equivalence of loading. BBM, brush border membrane; IEC, intestinal epithelial cell; SGLT1, SLC5A1.
