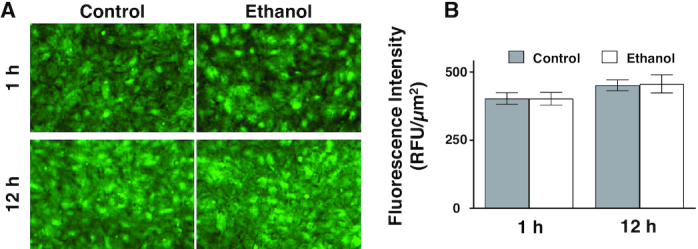
FIGURE 4.

SGLT1 expression in IEC-18 cells after exposure to ethanol. (A) The effect of ethanol on SGLT1 expression in IEC-18 cells imaged with the 20× objective. (B) 1 h of ethanol did not significantly change SGLT1 immunofluorescence intensity in IEC-18 cells (n = 4). Each sample is an average of at least 5 different images obtained with a 20× objective. Values represent the means ± SEMs. IEC, intestinal epithelial cell; RFU, relative fluorescence units; SGLT1, SLC5A1.
