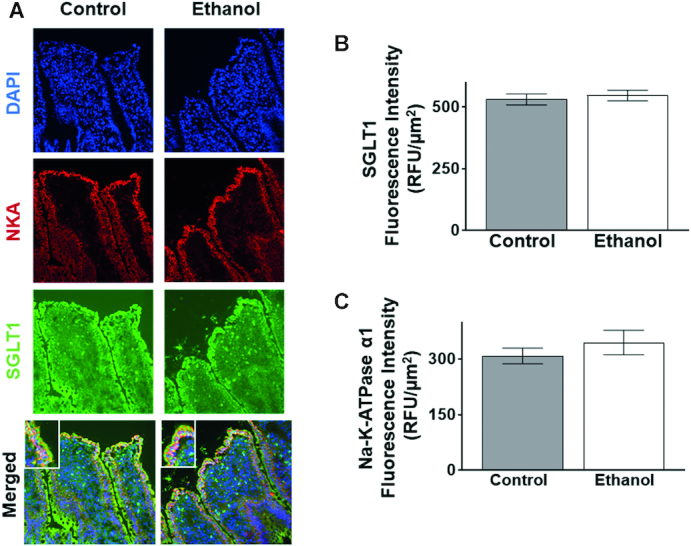
FIGURE 8.

An oral gavage of ethanol in Sprague-Dawley rats did not change SGLT1 or Na-K-ATPase expression. (A) SGLT1 and Na-K-ATPase expression in Sprague-Dawley rats after exposure to 1 h of ethanol. The blue stain represents DAPI, the green stain represents SGLT1, and the red stain represents the Na-K-ATPase. SGLT1 is localized at the apical side, or BBM, of the cell while the Na-K-ATPase is localized at the BLM. (B) 1 h of ethanol did not significantly change SGLT1 immunofluorescence intensity in Sprague-Dawley rats (n = 4). (C) 1 h of ethanol did not significantly change Na-K-ATPase immunofluorescence intensity in Sprague-Dawley rats (n = 4). Each sample is an average of at least 5 different images obtained with a 20× objective. Values represent the means ± SEMs. BBM, brush border membrane; BLM, basolateral membrane; DAPI, 4',6-diamidino-2-phenylindole; SGLT1, SLC5A1.
