
FIGURE 1.
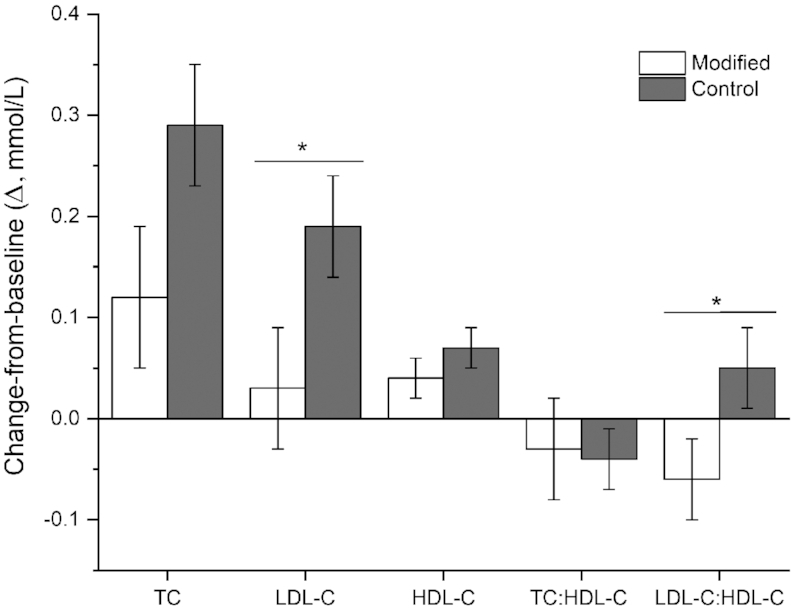
Δ fasting cholesterol profile after 12-wk diets that incorporated modified and control dairy products. Values are unadjusted means ± SEMs. n = 54. Linear mixed-model analyses were used to calculate overall effect of treatment based on Δ values, with adjustments made for fixed effects of baseline values of the assessed variable, period, treatment sequence, gender, age, and BMI. Participant was included as a random effect. The Δ values after each 12-wk dietary intervention were calculated by subtracting week 0 from week 12 values; and week 20 from week 32 values. No period effects were observed in the model for any outcome measure. *P < 0.05. HDL-C, HDL cholesterol; LDL-C, LDL cholesterol; TC, total cholesterol; Δ, change-from-baseline.