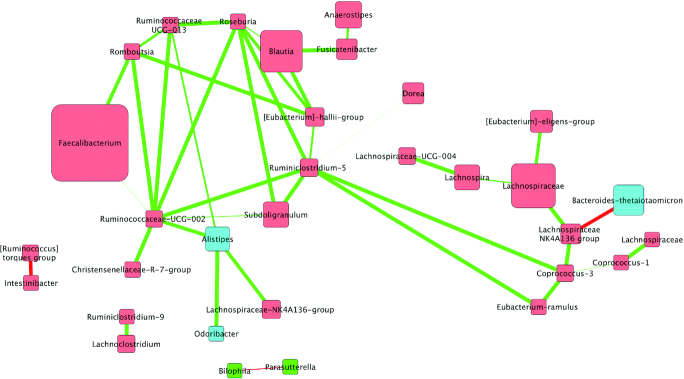
FIGURE 2.
Correlations between bacterial communities following the walnut fatty acid matched diet in adults at increased cardiovascular risk (n = 42). Biom-formatted ASV tables were used to produce a CoNet of ASVs present across 50% samples within a given diet through use of the CoNet tool (25). Pearson and Spearman correlations were used to determine the relations (positive or negative) between the ASVs (α = 0.05) denoted by green edges (positive correlations) or red edges (negative correlations). Nodes are colored by phylum and size is relative to the abundance of the taxa analysis for the walnut diet. Nodes (colored squares) were colored by phylum (all members of the same phylum are identical colors) and labeled by the genus or lowest available assigned taxonomic level. Blue nodes represent Bacteroidetes and red nodes represent Firmicutes. In addition, node size is relative to the abundance of the taxa (larger squares indicate larger abundance, whereas smaller squares indicate a lower abundance). ASV, amplicon sequence variant; CoNet, Co-occurrence Network.

