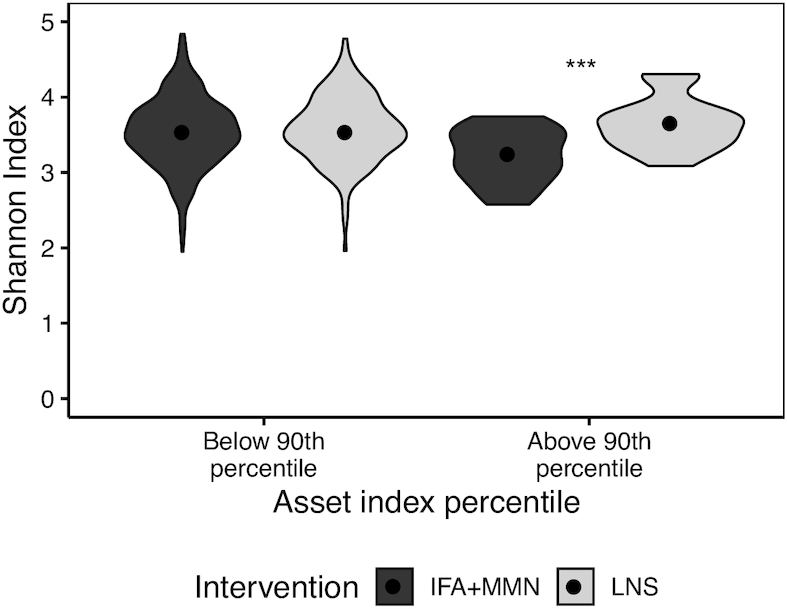
FIGURE 4.

Shannon index at 30 mo as a function of baseline asset index percentile by intervention group. Sample sizes for IFA + MMN compared with LNS groups were as follows: below 90th percentile (351 compared with 170) and above 90th percentile (26 compared with 20). ***IFA + MMN and LNS groups differ, P < 0.001. IFA, iron and folic acid; LNS, lipid-based nutrient supplement; MMN, multiple micronutrients.
