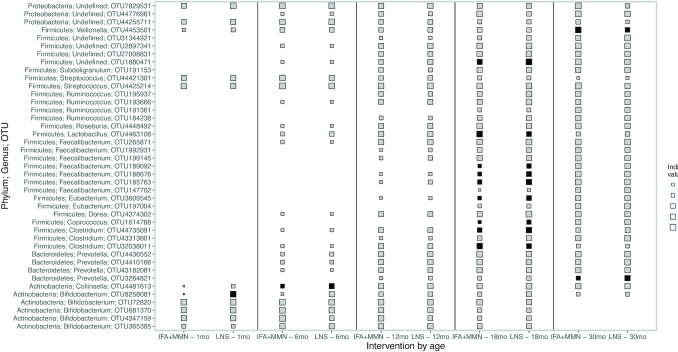
FIGURE 5.
Indicator species analysis at genus level by intervention at 1 mo, 6 mo, 12 mo, 18 mo, and 30 mo. The size of each square is proportional to the size of the indicator species value metric. Sample sizes at each time point for the IFA + MMN compared with LNS groups were as follows: 1 mo (225 compared with 106), 6 mo (347 compared with 168), 12 mo (419 compared with 211), 18 mo (414 compared with 208), and 30 mo (382 compared with 193). () IFA + MMN and LNS groups differ, P < 0.05 (before the Benjamini-Hochberg correction). IFA, iron and folic acid; LNS, lipid-based nutrient supplement; MMN, multiple micronutrients.

