
Figure 4. Microbiota analysis of colonic fecal samples following post-antibiotic treatment.
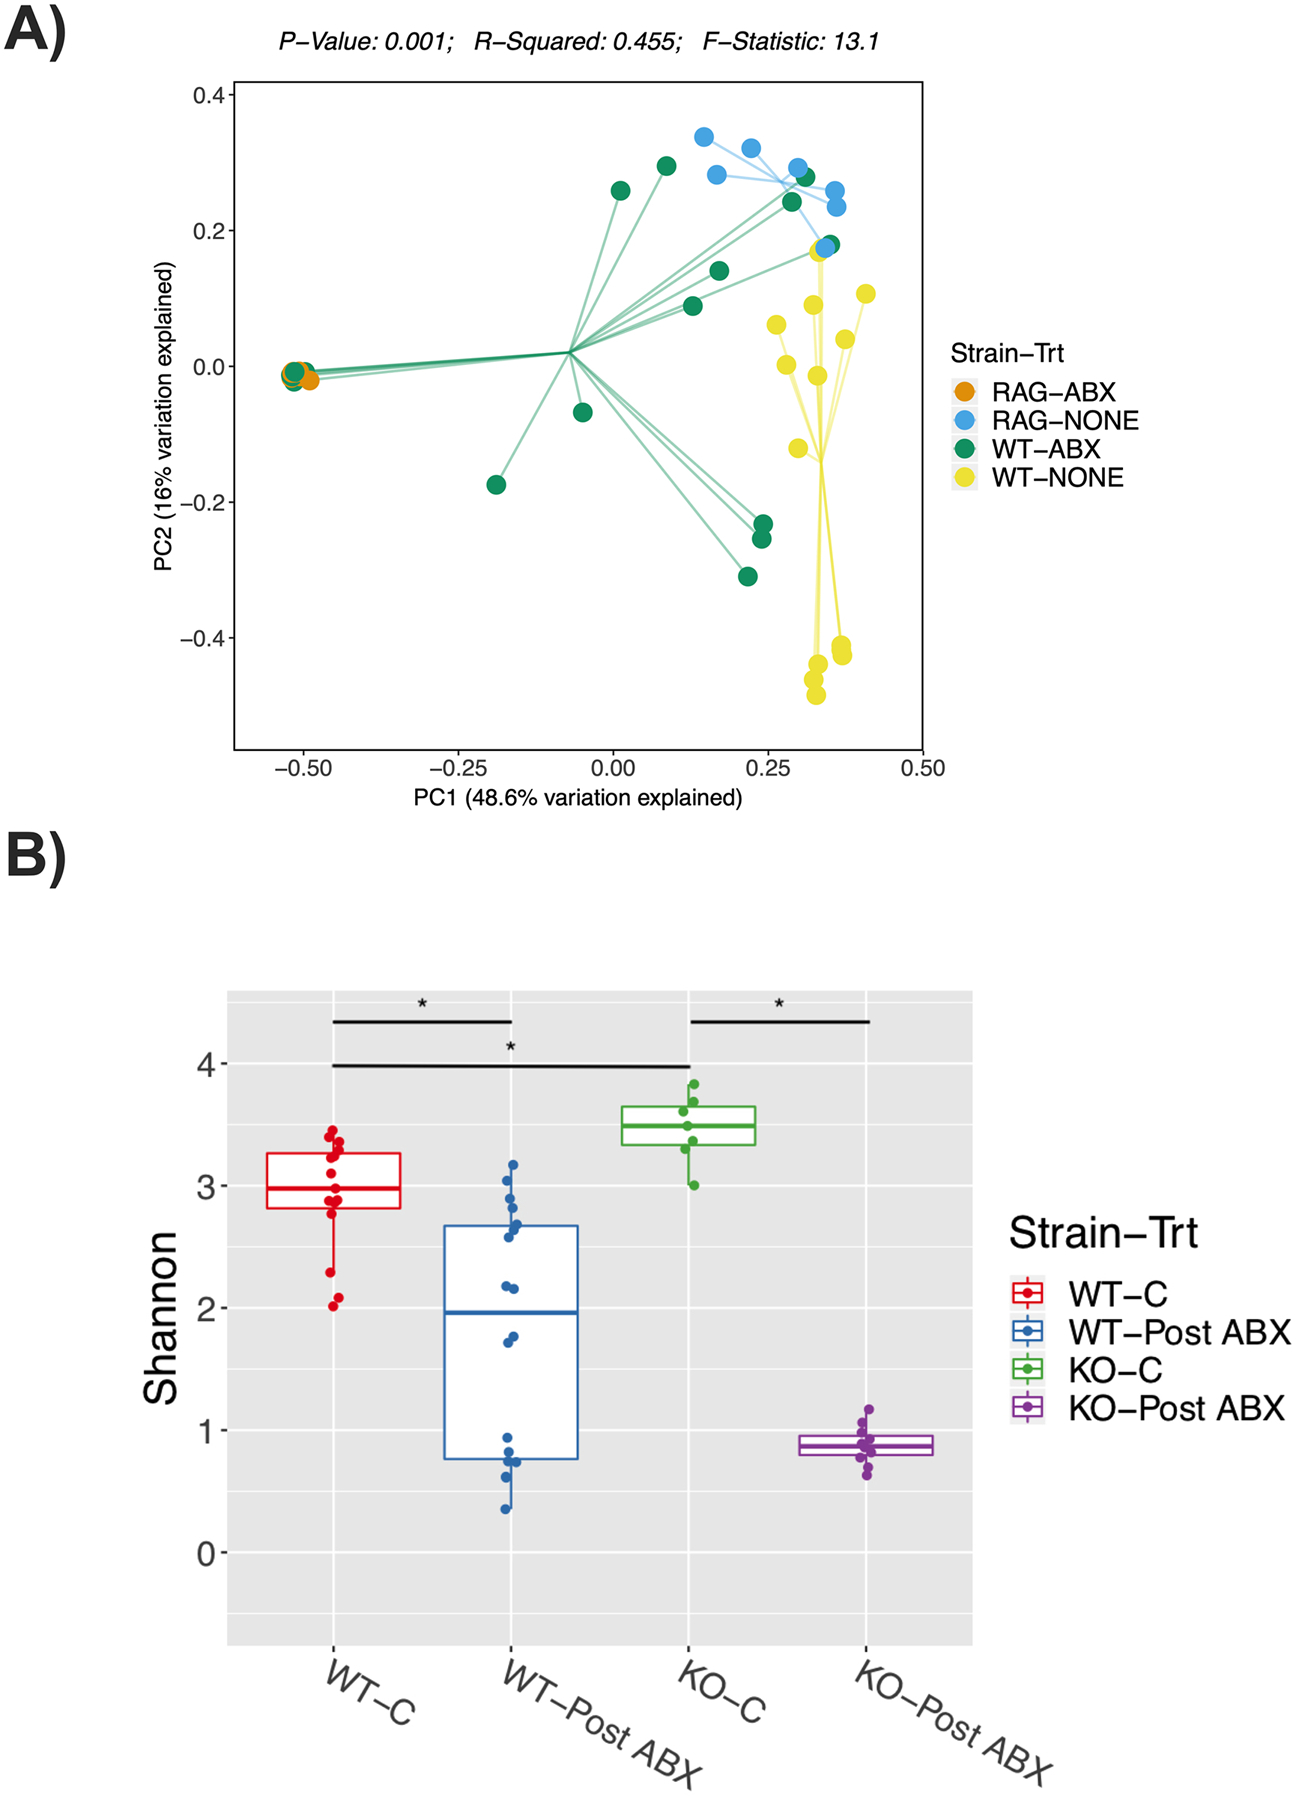
12-week-old C57BL/6 and Rag2-KO male mice were treated with water or antibiotics (ABX) for 2-weeks followed by 4 weeks of no treatment (repopulation). Colonic fecal samples were collected from these mice and analyzed by 16S sequencing. Principal co-ordinates analysis (PCoA) plot of fecal microbiome, A) Bray-Curtis analysis performed; The F-statistic provides information on the degree of effect caused by the antibiotic treatment, the p-value reflects the certainty of the F-statistic given the data, and R2 reflects the overall ability of the model to explain all of the data. B) Shannon Diversity. Statistical analysis was done using Mann-Whitney U test and P-values were adjusted using Benjamini and Hochberg’s method with FDR of <0.05. * refers to p<0.005. Values represent mean ± standard error. n=7–17 per group. C: control, Post-ABX: antibiotic treated for 2 weeks followed by 4 weeks of no treatment. WT: wild type, KO: Rag2 KO.