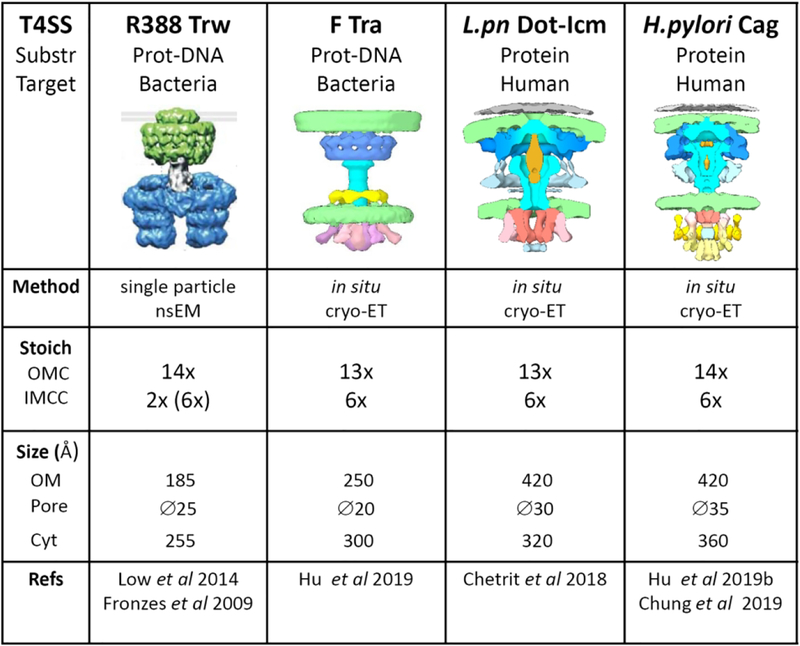
Figure 2.
Comparison of the 3D structure of T4SS from plasmid R388 (Low et al., 2014), plasmid F (Hu et al., 2019a), L pneumophila Dot-Icm (Chetrit et al., 2018), and H. pylori Cag (Hu et al., 2019b). Below each T4SS, the nature of the translocated substrate (Protein or protein-DNA complexes) and the target cell (bacteria or human) is indicated. The R388 T4SS image is from (Galan et al., 2018). The images for the F-Tra, Dot-Icm and Cag T4SS were kindly provided by Bo Hu (University of Texas, USA). The lanes below show the method for 3D structure elucidation, the stoichiometry of the subcomplexes, and the size of the structure (in Armstrongs) at the outer membrane (OM) side (the diameter of the pore is shown below) or the cytoplasmic (Cyt) side.

