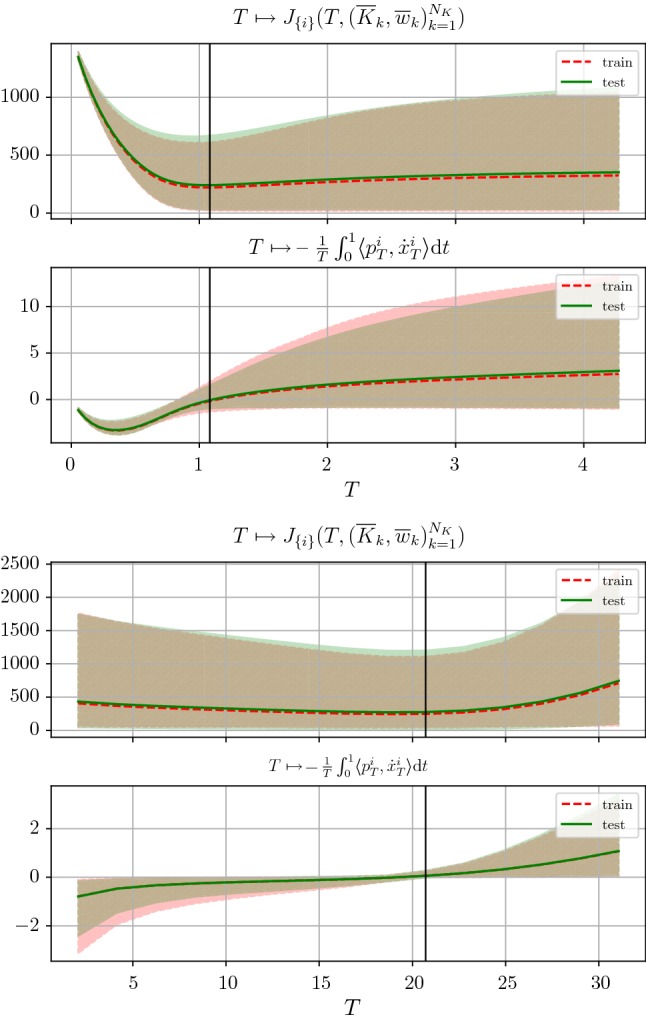
Fig. 7.

Plots of the energies (first and third plot) and first-order conditions (second and fourth plot) for training and test set with for denoising (first pair of plots) and / for deblurring (last pair of plots). The average value across the training/test sets are indicated by the dotted red/solid green curves. The area between the minimal and maximal function value for each T across the training/test set are indicated by the red and green area, respectively (Color figure online)
