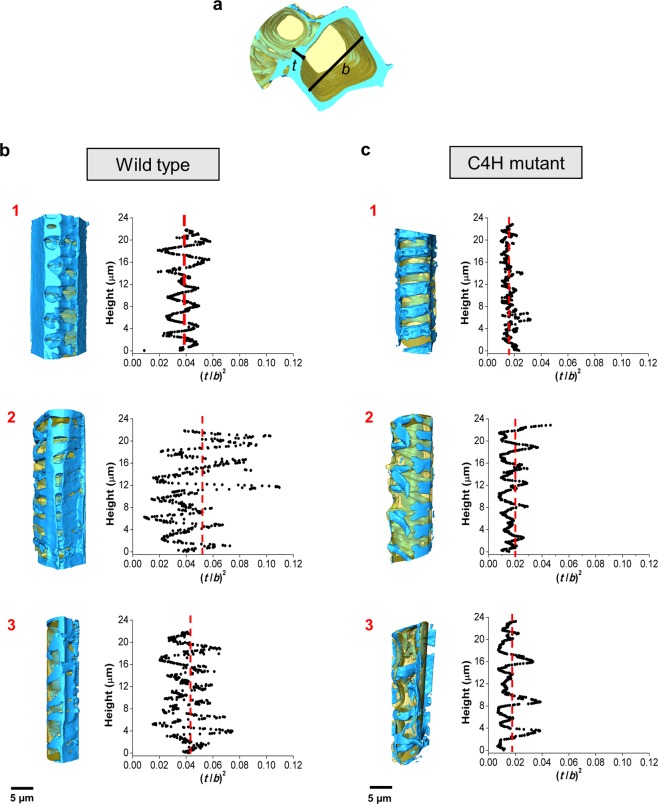
Figure 6.
Vessel implosion resistance analysis. (a) rendering indicating the structures selected for the analysis, the double wall thickness, t, and the lumen diameter, b, measured by the EDT algorithm to calculate the implosion resistance along the cellular height. The vessel cells of wild type (b), and C4H mutant plants (c) were individualised (rendering on the left) and the implosion resistance parameter, (t/b)2, was calculated and plotted according to the cellular heights (right), for each cell (1 to 3). The red dotted line represents the average (t/b)2 showing the displacement to lower values from wild type to the mutant cells.

