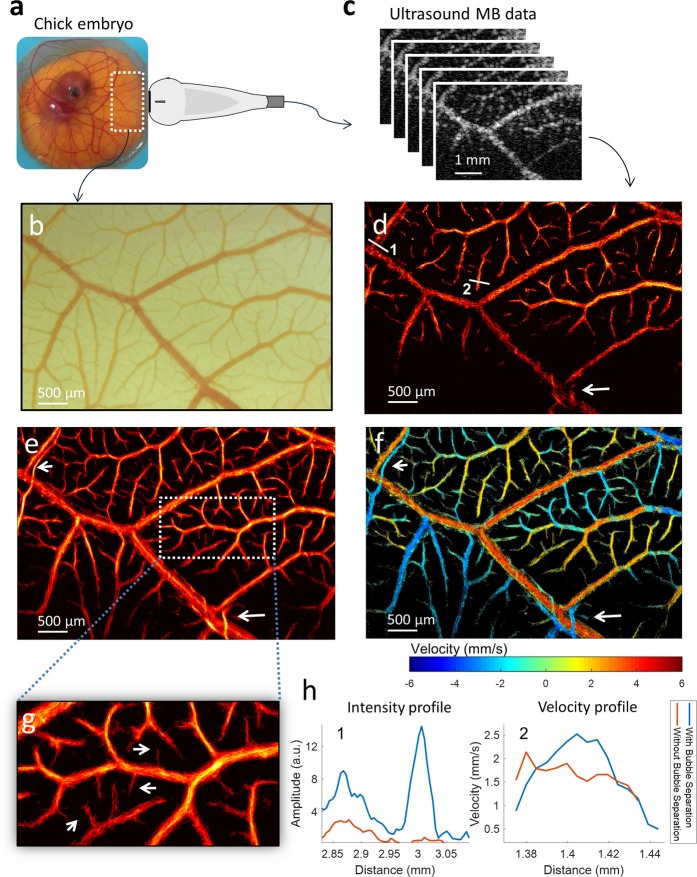
Figure 4.
Chicken embryo CAM imaging with microscopic imaging validation. (a) An ex ovo chicken embryo imaged with a high-frequency transducer through an acoustic window in the side of container. (b) Co-registered optical imaging of the ultrasound field-of-view. (c) Ultrasound MB data was used to generate ULM super-resolution images. (d) Conventional ULM image reconstruction without microbubble separation. Lines 1 and 2 denote two manually selected vessel cross-sections of interest. (e) ULM intensity image with microbubble separation method. (f) ULM velocity map generated with microbubble separation. The arrows highlight adjacent vessels with opposing flow directions. (g) Magnified section of CAM with arrows pointing out microvasculature that was not detected by conventional ULM. (h) Intensity and velocity profiles of CAM vessels from manually selected line segments.

