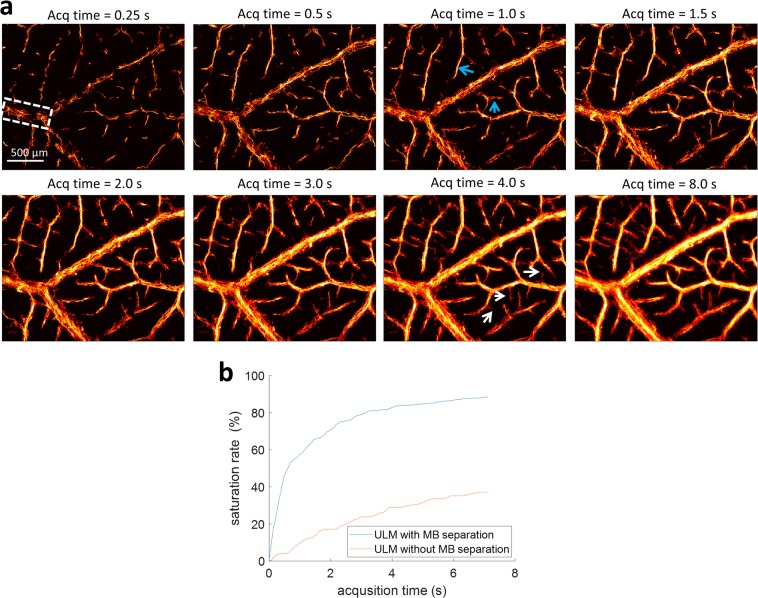
Figure 5.
Influence of data acquisition time. (a) Super-resolved microbubble localization images of the CAM surface vasculature with incrementally increasing data acquisition lengths (accumulation time). Most of the microvessels, down to the ~10 µm diameter range, could be resolved within ~4 seconds using the MB separation technique. (b) The saturation rate of the vessel region indicated by the rectangle in Fig. 5a demonstrates that the vessel lumen was mostly populated within the first 2–3 seconds and plateaued beyond 4 s for the MB separation method, while for conventional ULM the saturation curve shows that the time to reach the plateau was much longer (>8 s).

