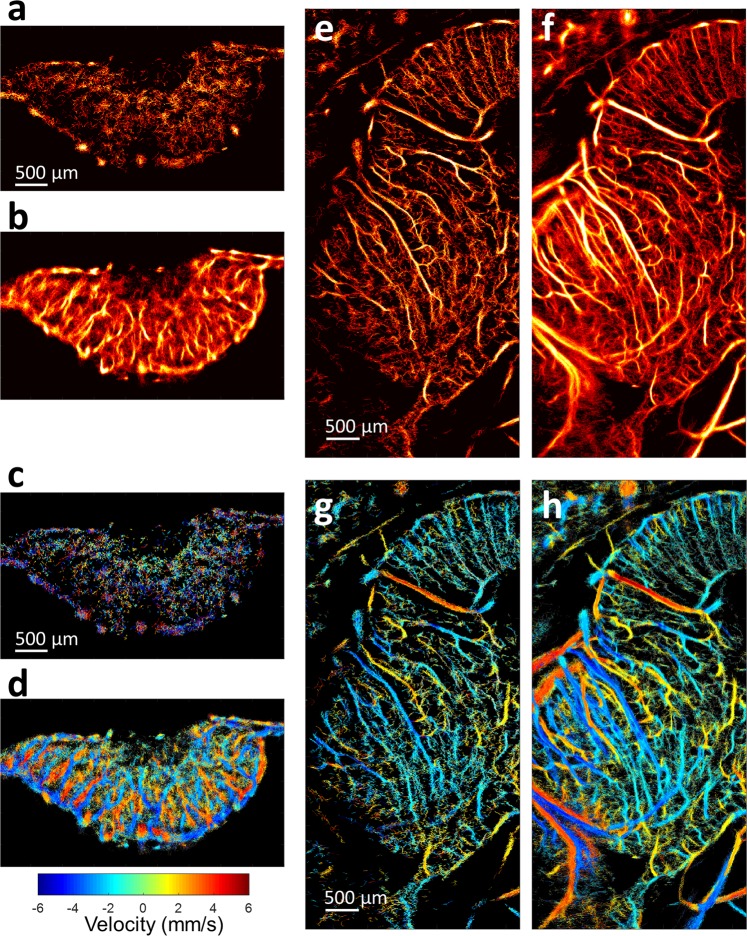
Figure 6.
Application of proposed method to chicken embryo tumor and brain. ULM images were generated for CAM tumor both (a) without microbubble separation and (b) with microbubble separation. The corresponding images depict ULM velocity maps (c) without microbubble separation and (d) with microbubble separation. Likewise, ULM images of chicken embryo brains were generated (e) without microbubble separation and (f) with microbubble separation. As with the tumor data, the velocity maps (g) without microbubble separation were less populated than the velocity maps (h) with microbubble separation.

