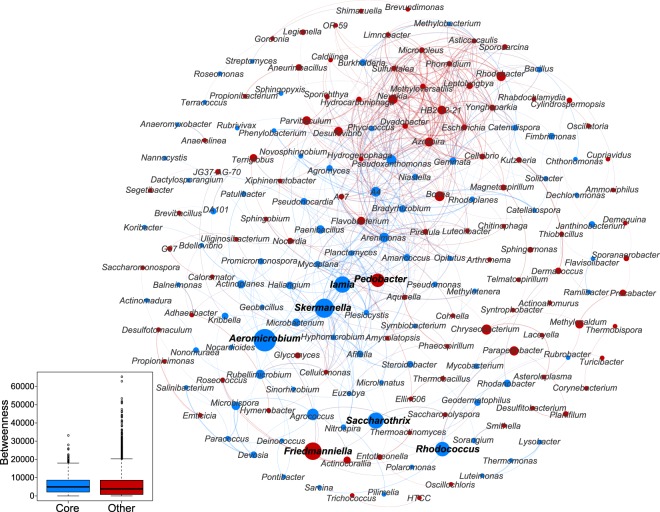
Figure 7.
Network of co-occurring bacterial genera in maize cropping systems based on correlation analysis. A connection stands for a strong (Spearman r > 0.6) and significant (P < 0.01) correlation. The size of each node is proportional to the betweenness centrality value; the thickness of the connection between two nodes (edge) is proportional to the value of the Spearman correlation coefficient. The nodes colors are based on categorization as a core (“Blue”) or other (“red”) taxa. The boxplot shows the comparison of betweenness centrality values between the core and other taxa in maize cropping systems. The values were significantly different between the two groups based on a Wilcoxon Rank Sum test (P < 0.05).

