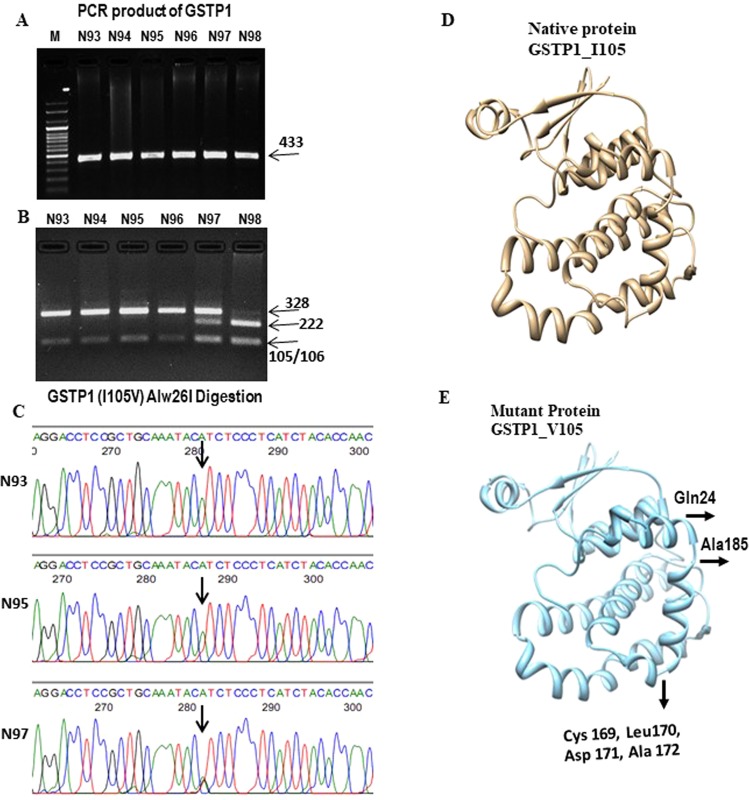
Figure 1.
Analysis of SNP of GSTP1 A313G and its 3D monomer structure. (A) A complete gel picture of the PCR-product of GSTP1 from six samples; M-marker. (B) A complete gel picture shows the result of PCR-RFLP analysis for GSTP1 SNP. The presence of Alw26I restriction site yielded 328 and 105 bp fragments for the A allele and 222, 105 and 106 bp fragments for the G allele. (C) Partial sequence chromatograms of GSTP1 A313G polymorphism (arrow marked) are shown from three subjects whose RFLP data are depicted in B. (D) 3D structure of wild GSTP1 I105 (Camel colour) and mutant GSTP1 V105 (Carolina blue colour). Altered sites were marked by arrows and showed the amino acids and its position.

