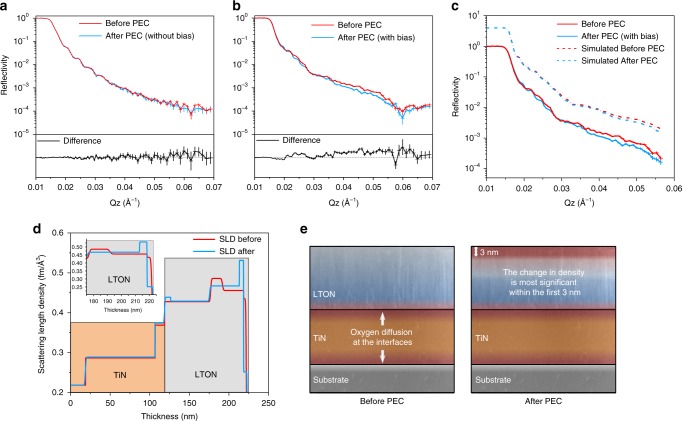
Fig. 4. Neutron reflectometry data for LTON thin films.
a Reflectivity plot for an LTON film exposed to electrolyte and light intensity, yet no external bias was applied to the sample and showed no photoelectrochemical performance. b Reflectivity curve for LTON thin film comparing before and after PEC measurements with applied bias. c Experimental and corresponding model fit for data shown in (b), shown by the solid and dashed lines respectively. d The inferred scattering length density profile as a function of depth from the corresponding fit. The inset shows the magnified region at and near to the surface of LTON. e Depth profile of the samples before and after PEC, where the largest change in the SLD corresponds to a more oxidised surface layer of 3 nm.

