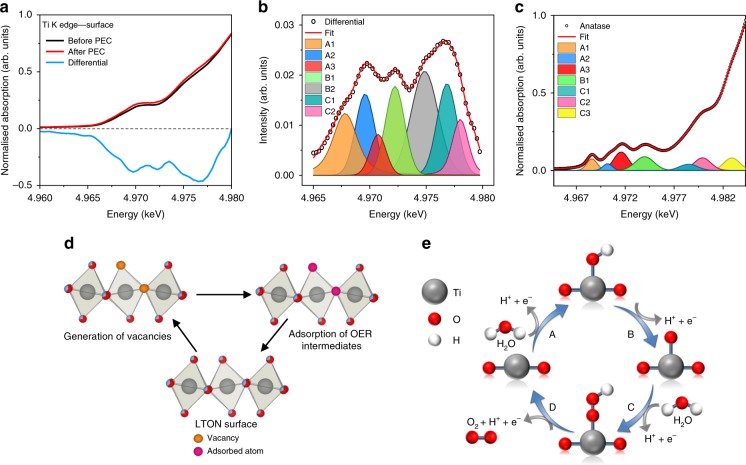
Fig. 6. LTON Ti K edge pre-edge differential and peak fit.
a The bare LTON film surface before and after PEC and the differential spectra shown in black, red and blue respectively. b Differential spectra and corresponding peak fitting analysis. c Peak fitting analysis for measured TiO2 anatase as a reference for peak assignments. d Ti(O/N)6 octahedra and the possible axial and equatorial positions for vacancy generation and adsorption sites. e Schematic representation of the OER mechanism.

