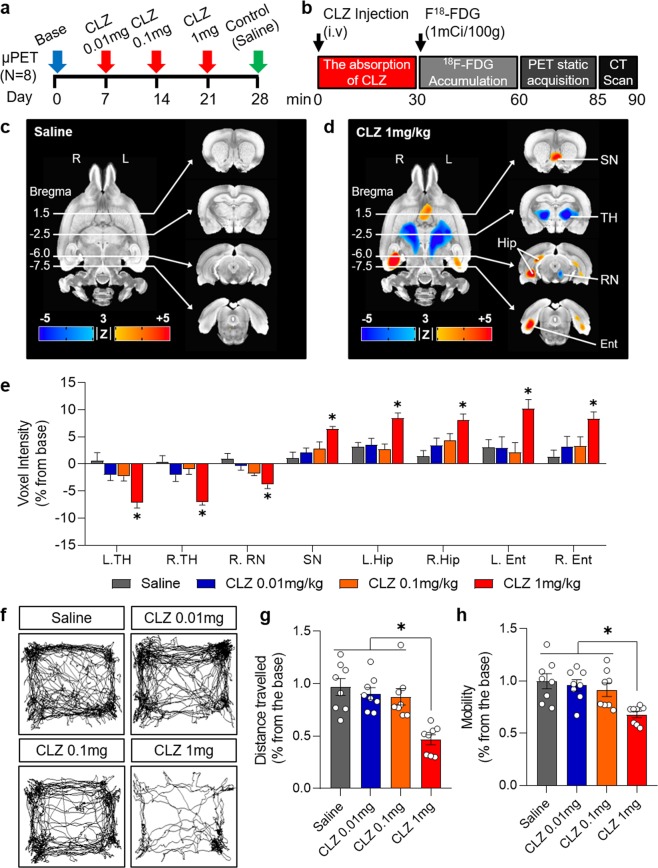
Figure 1.
Clozapine-induced metabolic and behavioral changes in naïve rats. (a) Experimental design for FDG-microPET scans with different doses of clozapine. (b) Timeline of the FDG-microPET scanning procedure. (c) FDG-microPET image after administration of saline (N = 8; 3dClustSim, AFNI, α = 0.05, p < 0.01, k < 39). (d) FDG-microPET image after administration of 1 mg/kg clozapine (N = 8; 3dClustSim, AFNI, α = 0.05, p < 0.01, k < 39). (e) Change in voxel intensity for regional glucose metabolism by dose of CLZ and anatomical location (N = 8; compared with the saline group, 1-way ANOVA with Dunn’s multiple comparisons, *p < 0.05). (f) Representative traces of locomotor activity in the open field test after administration of CLZ. (g) Total distance traveled and (h) mobility in the open field test measured over 30 minutes starting 30 minutes after administration of CLZ or saline (N = 8; 1-way ANOVA with Tukey’s multiple comparisons, *p < 0.05). CLZ, clozapine; L, left; R, right; SN, septal nucleus; TH, thalamus; RN, red nucleus; Hip, hippocampus; Ent, entorhinal cortex.

