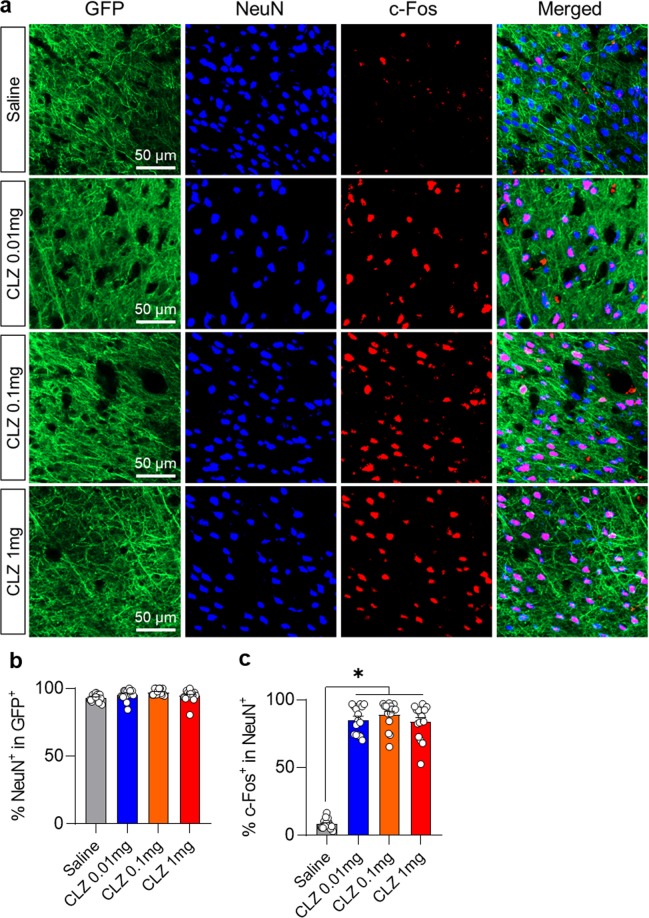
Figure 4.
c-Fos expression after administration of different doses of CLZ. (a) Representative sections from the somatosensory cortices showing c-Fos expression after different doses of CLZ. (b) Quantitative comparison of cells co-labeled for GFP and NeuN after different doses of CLZ. (c) Quantitative comparison of cells co-labeled for c-Fos and NeuN after different doses of CLZ. (Saline (N = 5), CLZ 0.01 mg/kg (N = 5), CLZ 0.1 mg/kg (N = 5), CLZ 1 mg/kg (N = 5); 1-way ANOVA with Tukey’s multiple comparisons, *p < 0.05).

