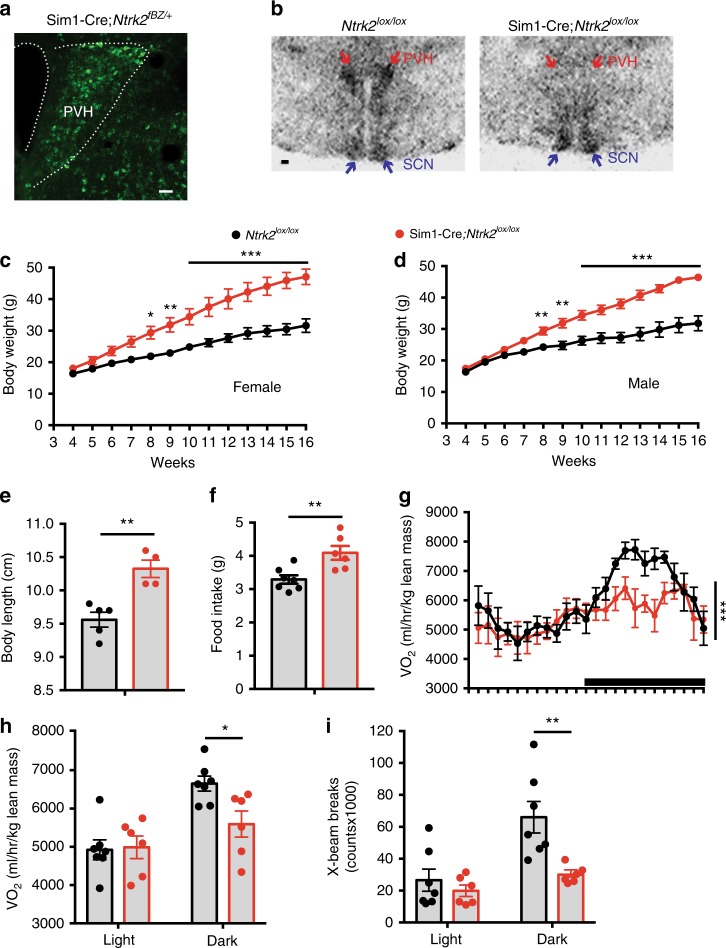
Fig. 2. Deletion of the Ntrk2 gene in Sim1-Cre cells led to obesity.
a β-galactosidase immunohistochemistry of Sim1-Cre;Ntrk2fBZ/+ mice. Scale bar, 50 μm. b In situ hybridization of brain sections from 4-month-old Ntrk2lox/lox mice (control) and Sim1-Cre;Ntrk2lox/lox mice (mutant) reveals that Ntrk2 gene expression was abolished in the PVH of mutant mice. Arrows denote the PVH and the suprachiasmatic nucleus (SCN). Scale bar, 200 μm. c Body weight of female control and mutant mice. n = 5 mice per genotype. Two-way ANOVA with post hoc Bonferroni multiple comparisons; F(1, 104) = 163.7, P < 0.0001 for genotype; *P < 0.05, **P < 0.01, and ***P < 0.001. d Body weight of male control and mutant mice. n = 4 controls and six mutants. Two-way ANOVA with post hoc Bonferroni multiple comparisons; F(1, 104) = 193.5, P < 0.0001 for genotype; **P < 0.01 and ***P < 0.001. e Body length of 8-week-old female control and mutant mice. n = 5 controls and four mutants. Two-tailed unpaired t test; **P = 0.003. f Daily food intake of 8-week-old female control and mutant mice. n = 7 controls and six mutants. Two-tailed unpaired t test; **P = 0.006. g Distribution of oxygen consumption (VO2) over a 24-h period in 6-week-old female mice. The black bar above x axis indicates the dark cycle. n = 7 controls and six mutants. Two-way ANOVA for genotype; F(1, 264) = 14.54, ***P = 0.0002. h VO2 of 6-week-old female mice during the light and dark cycles. n = 7 controls and six mutants. Two-tailed unpaired t test; *P = 0.017. i Locomotor activity of 6-week-old female mice during the light and dark cycles. n = 7 controls and six mutants. Two-tailed unpaired t test; **P = 0.007. Error bars indicate SEM. Source data are provided as a Source Data file.

