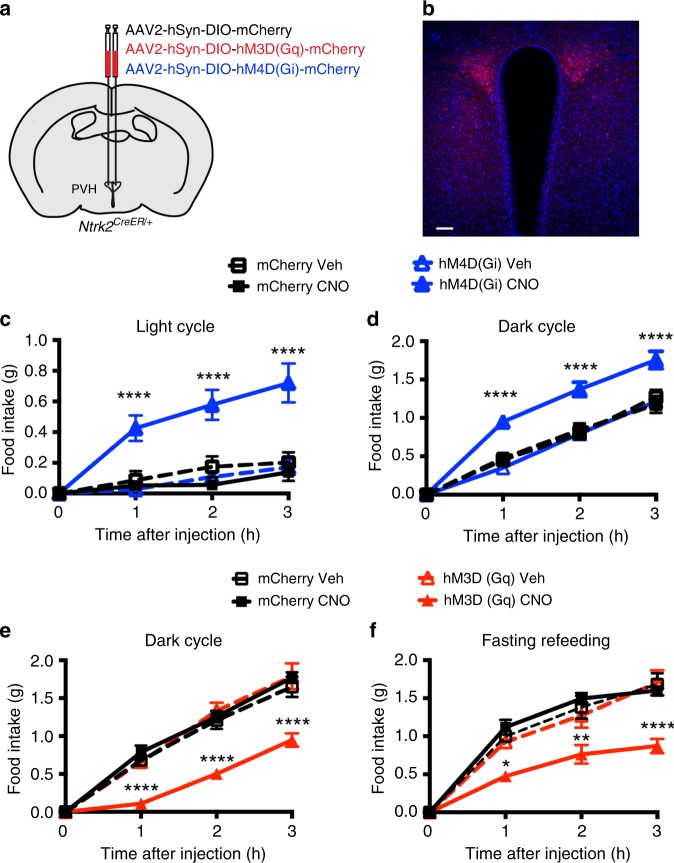
Fig. 4. Chemogenetic modification of PVHTrkB neuronal activity alters food intake.
a A diagram showing bilateral injection of AAV2-hSyn-DIO-mCherry, AAV2-hSyn-DIO-hM3D(Gq)-mCherry, or AAV2-hSyn-DIO-hM4D(Gi)-mCherry into the PVH of Ntrk2CreER/+ mice. b A confocal imaging showing mCherry expression of injected AAV in the PVH. Brain sections were counter-stained with DAPI. The scale bar represents 100 μm. c Inhibition of PVHTrkB neurons stimulated food intake during the light cycle. n = 5 and six mice for AAV2-hSyn-DIO-mCherry (mCherry) and AAV2-hSyn-DIO-hM4D(Gi)-mCherry [hM4D(Gi)] groups, respectively. Two-way ANOVA with post hoc Tukey’s multiple comparisons; F(3, 72) = 35.23, P < 0.0001 for virus and treatment; ****p < 0.0001 when compared to the hM4D(Gi)-vehicle (Veh) group. d Inhibition of PVHTrkB neurons stimulated food intake during the dark cycle. n = 6 and six mice for mCherry and hM4D(Gi) groups, respectively. Two-way ANOVA with post hoc Tukey’s multiple comparisons; F(3, 76) = 31.49, P < 0.0001 for virus and treatment; ****p < 0.0001 when compared to the hM4D(Gi)-Veh group. e Activation of PVHTrkB neurons suppressed food intake during the dark cycle. n = 6 and seven mice for AAV2-hSyn-DIO-mCherry (mCherry) and AAV2-hSyn-DIO-hM3D(Gq)-mCherry [hM3D(Gq)] groups, respectively. Two-way ANOVA with post hoc Bonferroni’s multiple comparisons; F(3, 22) = 17.27, P < 0.0001 for virus and treatment; ****P < 0.0001 when compared to the hM3D(Gq)-Veh group. f Activation of PVHTrkB neurons suppressed fasting-induced appetite. n = 6 and seven mice for mCherry and hM3D(Gq) groups, respectively. Two-way ANOVA with post hoc Bonferroni’s multiple comparisons; F(3, 22) = 10.47, P < 0.0001 for virus and treatment; *P < 0.05, **P < 0.01, and ****P < 0.0001 when compared to the hM3D(Gq)-Veh group. Error bars indicate SEM. Source data are provided as a Source Data file.

