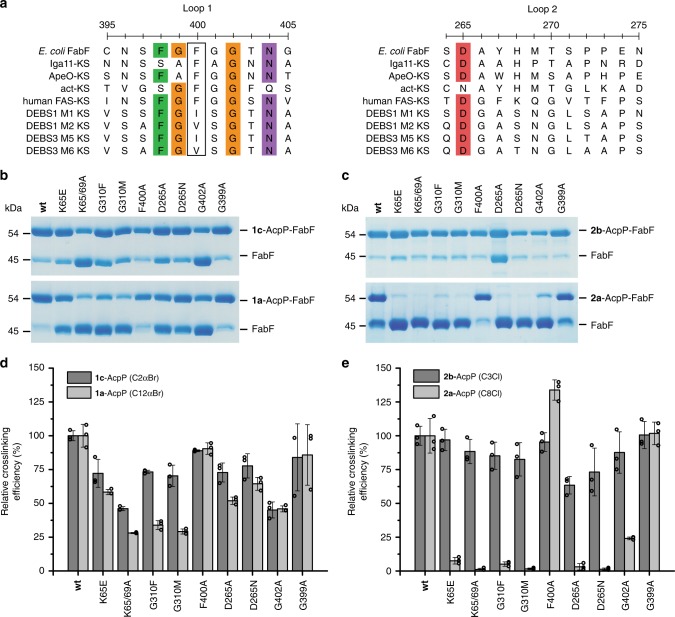
Fig. 6. Loop 1 and 2 Sequence conservation and mutagenesis.
a Sequence alignment of loops 1 and 2 of FabF with representative KS sequences from non-iterative type II PKS (Iga11, ApeO), iterative type II PKS (act-KS), type I FAS (Human-FAS-KS), and type I PKS (DEBS KSs). The putative gating residue (Phe400 in FabF) for each synthase is outlined in a black box. b Single time point crosslinking gels of 1c-AcpP (C2αBr-AcpP) and 1a-AcpP (C12αBr-AcpP) with FabF gating mutants. c Single time point crosslinking gels of 2b-AcpP (C3Cl-AcpP) and 2a-AcpP (C8Cl-AcpP) with FabF gating mutants. d Densitometric analysis of single time-point crosslinking efficiency of 1c-AcpP (C2αBr-AcpP) and 1a-AcpP (C12αBr-AcpP) with FabF mutants. e Densitometric analysis of single time-point crosslinking efficiency of 2b-AcpP (C3Cl-AcpP) and 2a-AcpP (C8Cl-AcpP) with FabF mutants. All crosslinking experiments from b and c were performed as biologically independent experiments (n = 3) and all data represented in d and e are the average crosslinking efficiency of each mutant normalized to the average of wt FabF crosslinking efficiency. The error bars in d and e are represented as standard deviation (±SD) and the individual normalized measurements from each independent experiment are overlaid on top of the associated bar plot as open circles. Source data for all experiments are provided as a Source Data file.

