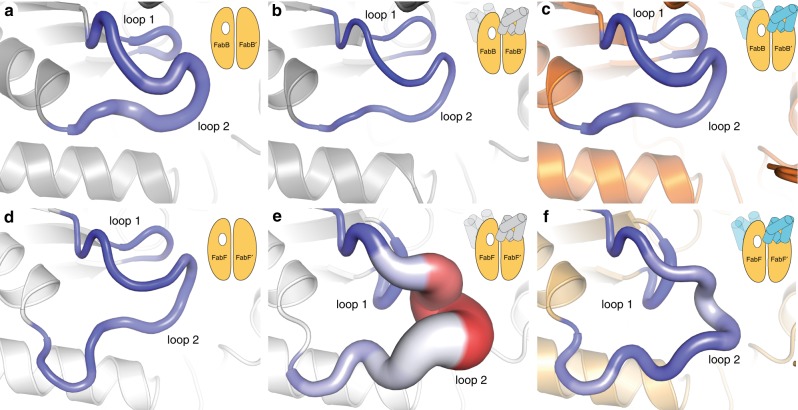
Fig. 7. Loop dynamism sampled via computer simulations.
Per residue root mean square fluctuations (RMSFs) of a, apo-FabB2; b apo-FabB2* (apo structure derived from AcpP2–FabB2 structure); c AcpP2·FabB2; d apo-FabF2; e apo-FabF2* (apo structure derived from AcpP2-FabF2 structure); f AcpP2·FabF2. Larger (per residue) backbone RMSF values correspond to a thicker “sausage”; color range (blue to white to red) illustrates (per residue) side chain RMSFs with the blue-to-red color range indicating small-to-large RMSF values.

