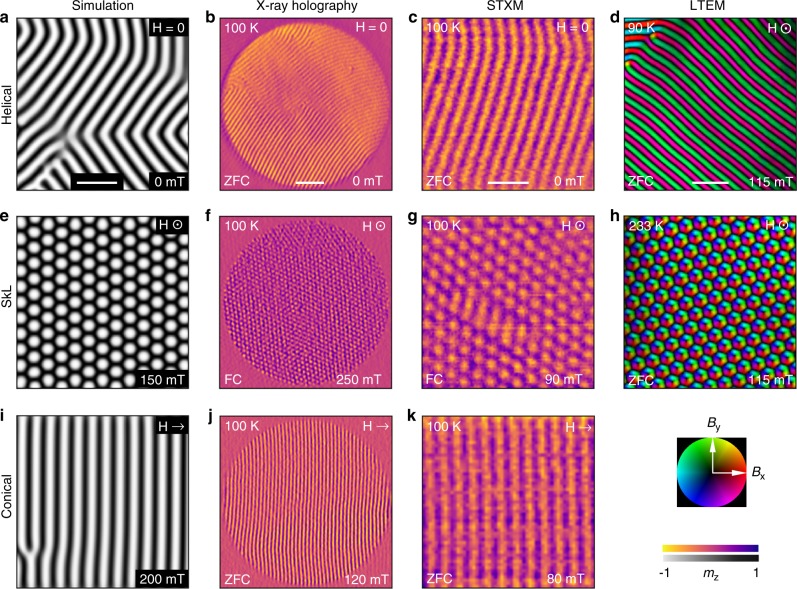
Fig. 3. Real-space imaging of chiral spin textures.
Micromagnetic simulations, experimental X-ray holography images, STXM images and LTEM images of the a–d helical, e–h SkL and i–k conical magnetic spin textures. The simulation, X-ray holography and STXM images plot the normalised out-of-plane magnetisation, mz, as the colourmap, while the LTEM images plot the in-plane magnetic flux density as the colourmap, with the direction indicated by the colour wheel at the bottom right. Scale bar in b, 500 nm. All other scale bars, 200 nm.

